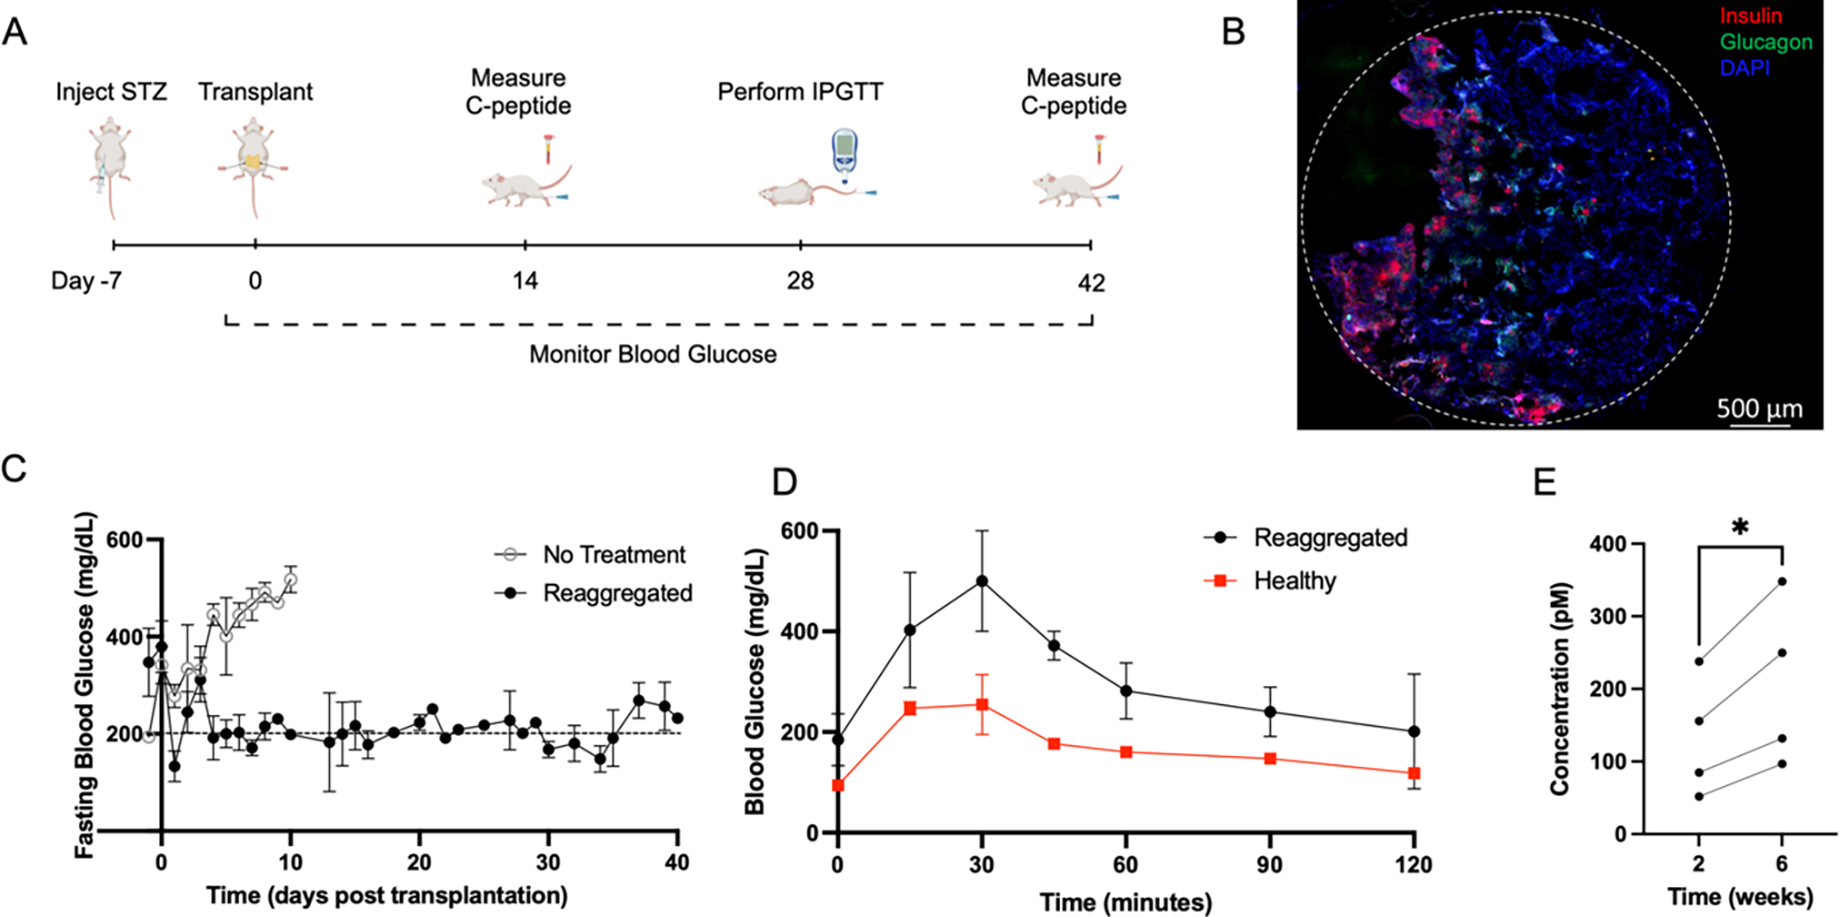
Figure 6.

(A) Timeline of in vivo studies, including timepoints induction of diabetes, transplantation of scaffolds to the peritoneal fat, collection of blood serum, and intraperitoneal testing of glucose tolerance. (B) Representative image of a scaffold section explanted after 14 days in vivo indicating survival of transplanted islet organoids. Scaffolds were cryosectioned and stained for human insulin (red), human glucagon (green) and DAPI (blue). The dashed line indicates the circumference of the scaffold. (C) Fasting blood glucose measurements from STZ-induced diabetic mice that received 10M reaggregated cells transplanted on two PLG scaffolds (5M cells/scaffold) (n=3) or no treatment (n=4). Mice were fasted for 4–6 hours prior to blood glucose readings. Blood glucose was measured daily for at least 10 days following transplantation, then 3 times per week for the duration of the study. (D) Blood glucose measurements taken during intraperitoneal glucose tolerance testing of mice that received reaggregated cells (S6D7) transplanted on PLG scaffolds (n=2) and healthy mice (n=2). Mice were fasted for 4–6 hours, then received an intraperitoneal injection of glucose at 2g/kg body weight at t=0. Average area under the curve for treated mice was 37,042 and for healthy mice was 20,655. (E) Circulating C-peptide levels at 2- and 6-weeks post transplantation, measured from serum collected through saphenous vein blood draw. Paired t-test performed using repeated measures from four mice at both time points. Significance level of α=0.05 used.
