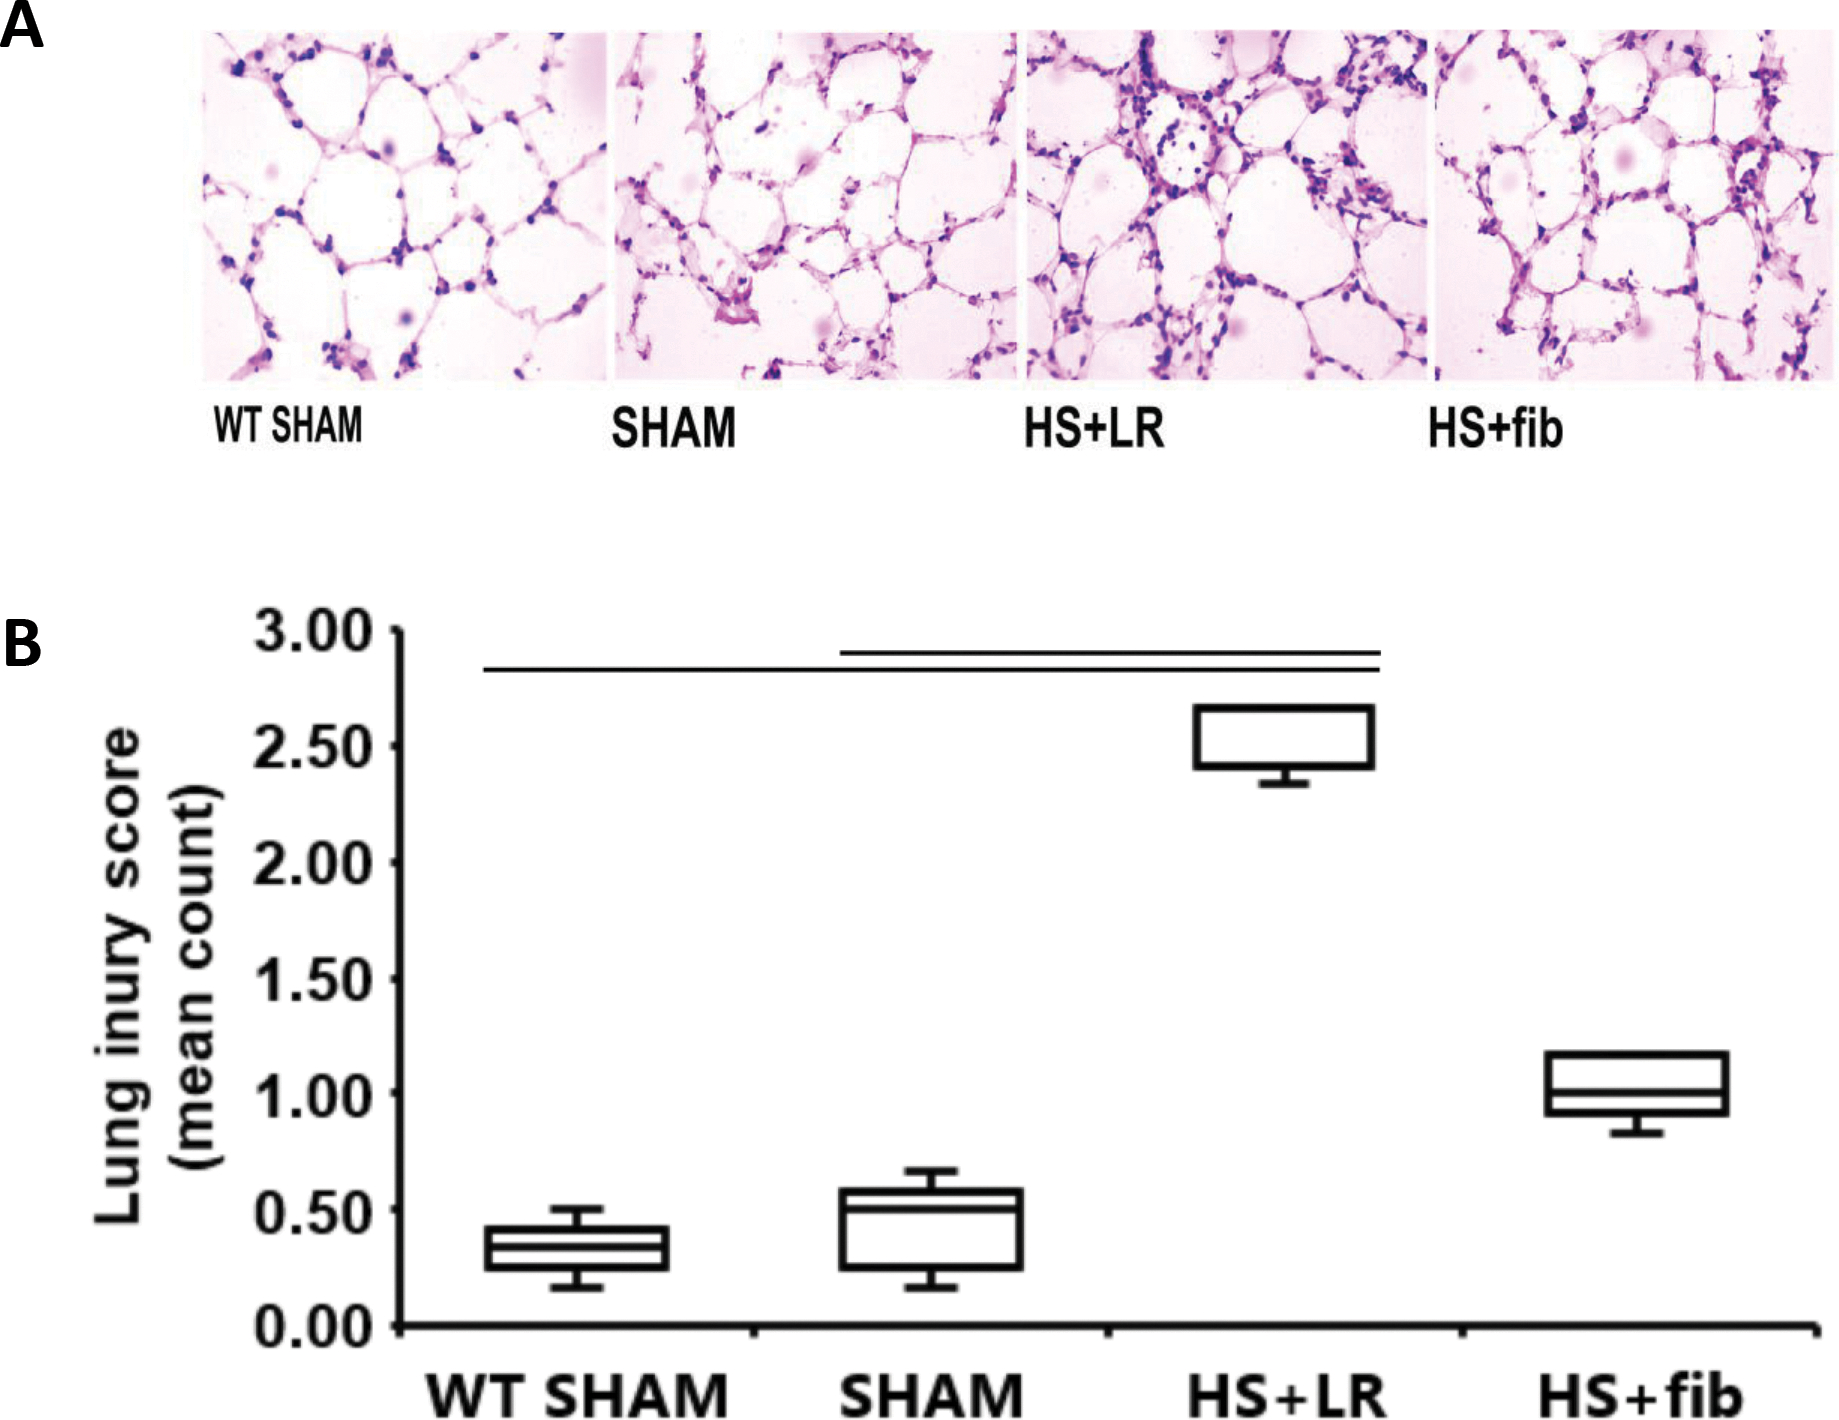
Fig. 2.

Lung histopathologic injury. Mice were treated as described in Fig. 1. Shown are representative H&E images (A) and the corresponding lung injury score counts (B). The values are presented as medians with IQR. Bars indicate relationships with p<0.05; n=5 per group.
