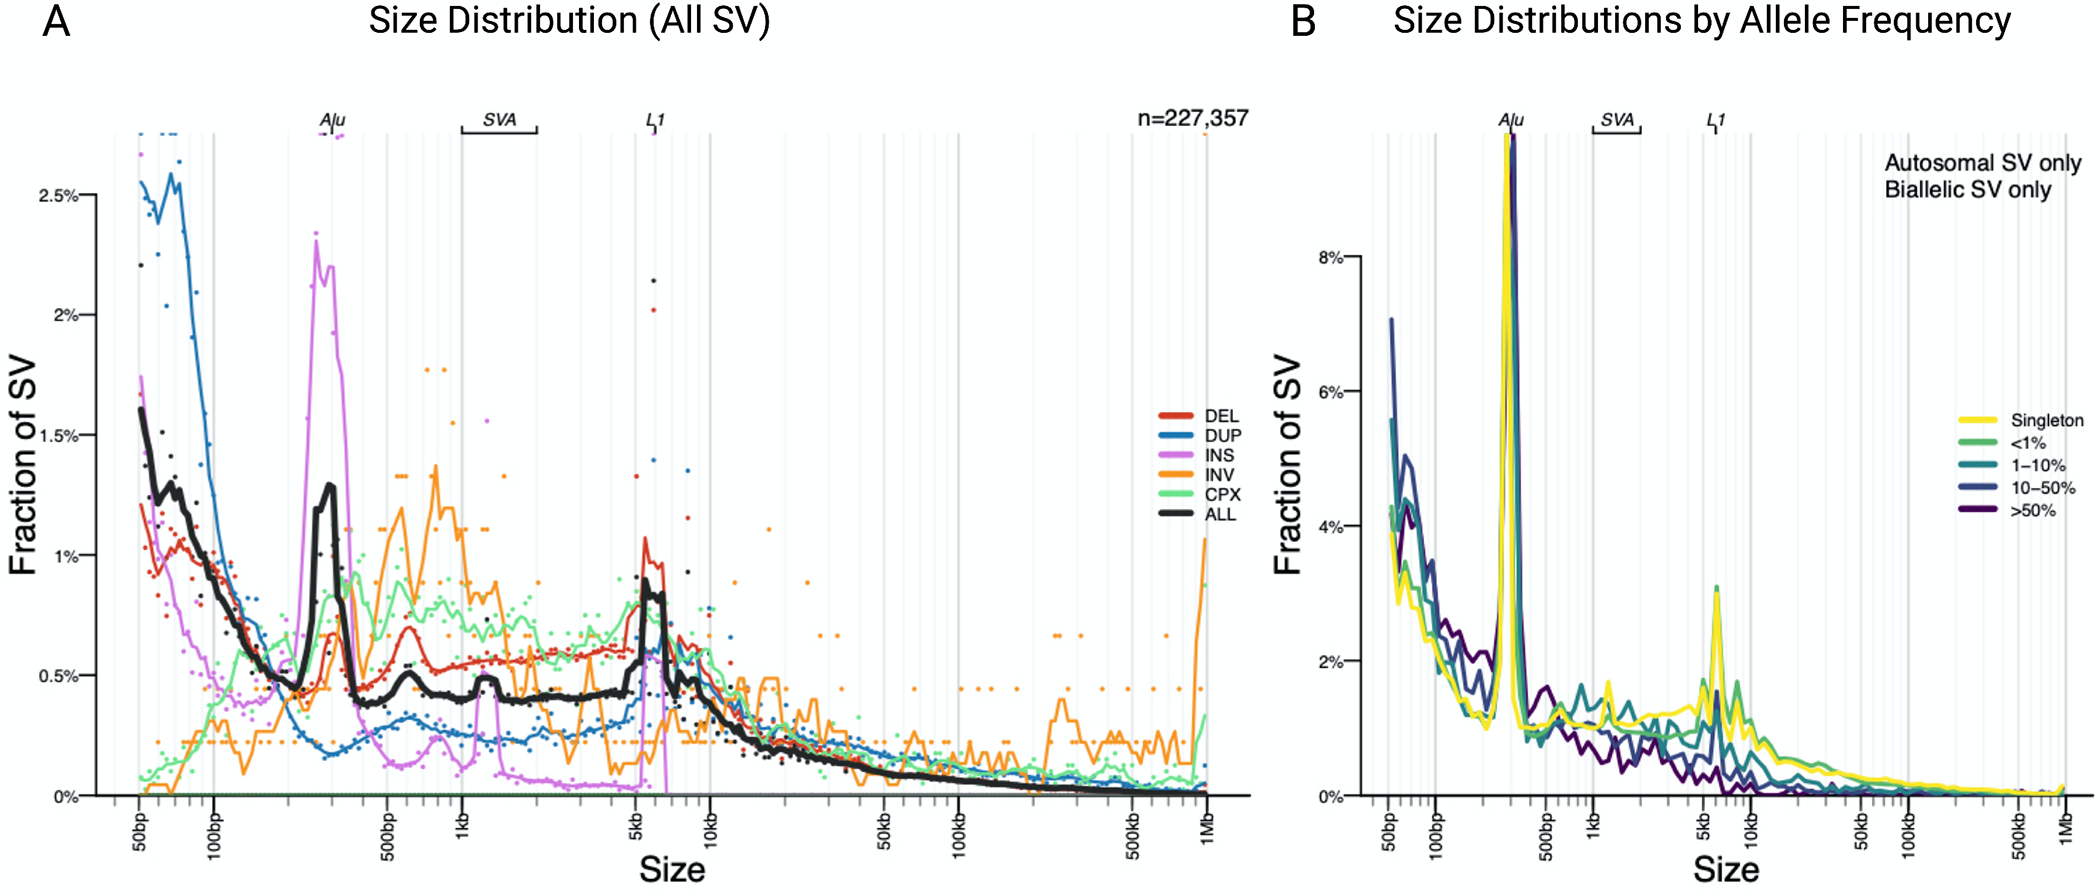
Figure 3: Size and allele frequency distribution of “PASS” SVs in the short-read data.

a) The majority of SVs are small and rare. As previously reported in other large-scale short-read studies three peaks are observed at 300bp, 2kb and 6kb, representing Alu, SVA and LINE1 mobile element insertions respectively. b) Most SVs were singleton variants (46.87%) or rare (AF<1%) (46.69 %).
