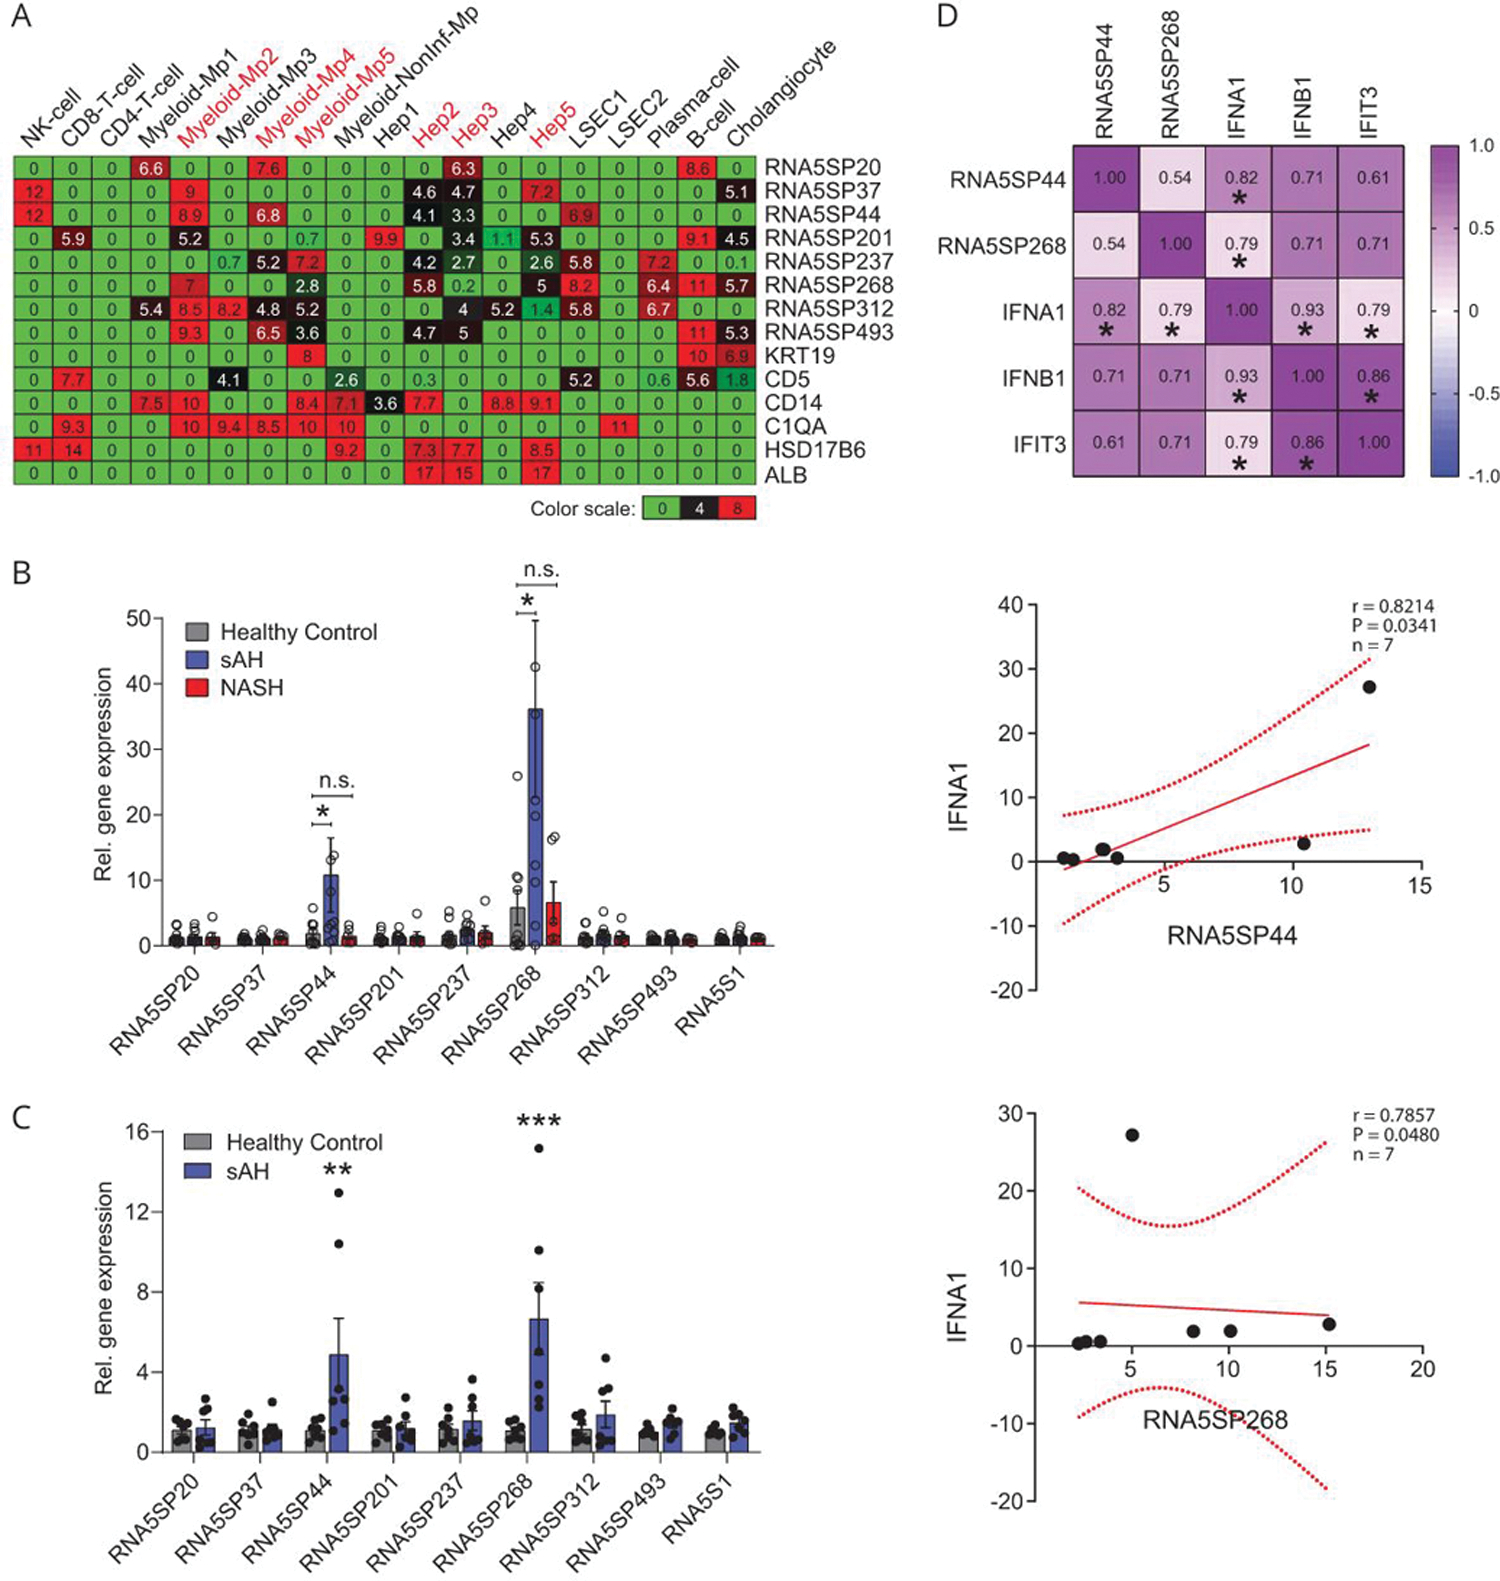
FIGURE 4.

RNA5SP transcripts are increased in PBMCs of patients with sAH. (A) Gene deconvolution analysis to impute cell type-specific expression of RNA5SP transcripts in sAH livers, which was performed on the transcriptomes of sAH livers (from DbGaP_phs001807) using CIBERSORTx. The values in the heatmap are the imputed expression values for each gene (row) and each cell type (columns). (B) Quantitative PCR quantification of RNA5SP expression in human PBMCs. Healthy controls and sAH: n = 10; NASH: n = 6. (C) Quantitative PCR quantification of RNA5SP expression in CD14+/CD16+ monocytes isolated from PBMCs of healthy controls or patients with sAH (n = 7). Data are mean ± SEM, *p < 0.05, **p < 0.01, ***p < 0.001 versus healthy control. (D) Top: Spearman correlation matrix. The numbers represent Spearman r; *p < 0.05, n = 7. Middle and bottom: scatter plots of Spearman correlation of the indicated genes. All correlation graphs were based on relative expression determined by quantitative PCR in CD14+/CD16+ monocytes from patients with sAH. Abbreviations: Hep 1–5, hepatocyte cluster 1 to 5; LSEC, liver sinusoidal endothelial cell; myeloid-Mp1–5, myeloid-derived cell clusters 1 to 5; NonInf-Mp, noninflammatory macrophage cluster; PBMC, peripheral blood mononuclear cell; sAH, severe alcohol-associated hepatitis.
