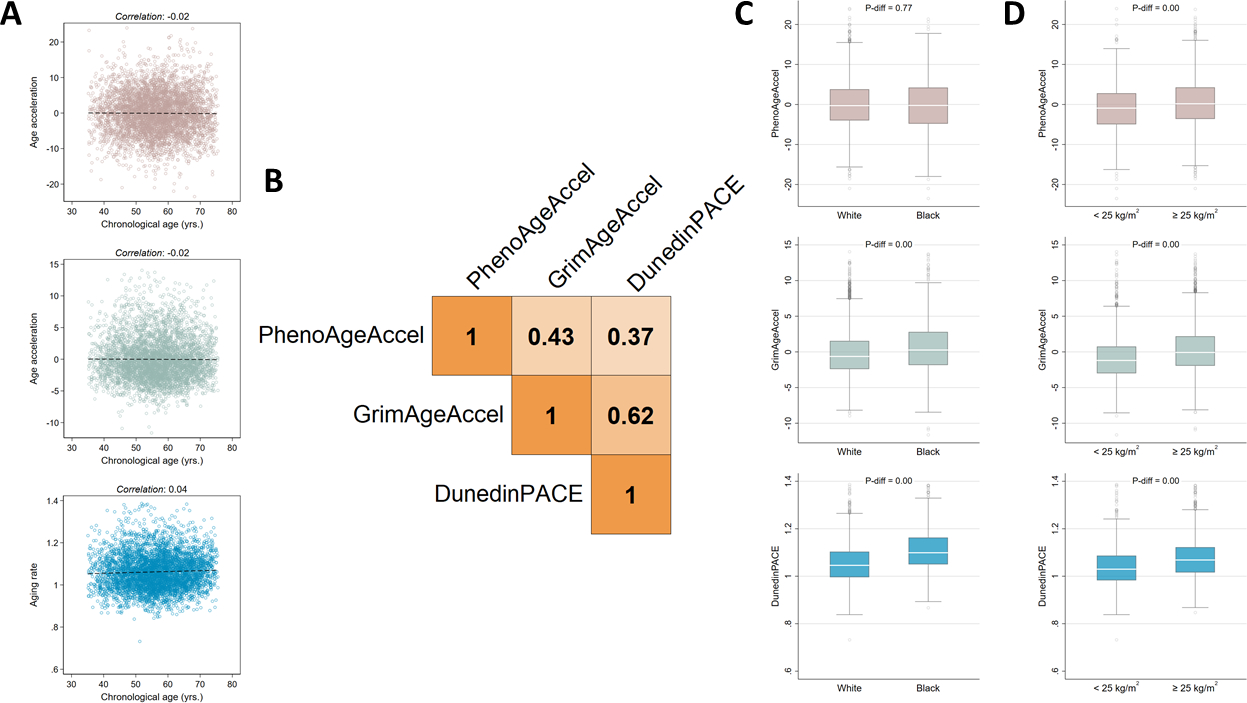
Figure 1. Biological age metric characteristics.

Scatter plots, linear fit lines and Pearson correlation coefficients for the relationship between the three biological age metrics and chronological age (A). A Pearson correlation coefficient matrix for the relationships between the three biological age metrics (B). Box plots for the three biological age metrics, stratified by self-reported race (C) and body mass index group (D).
