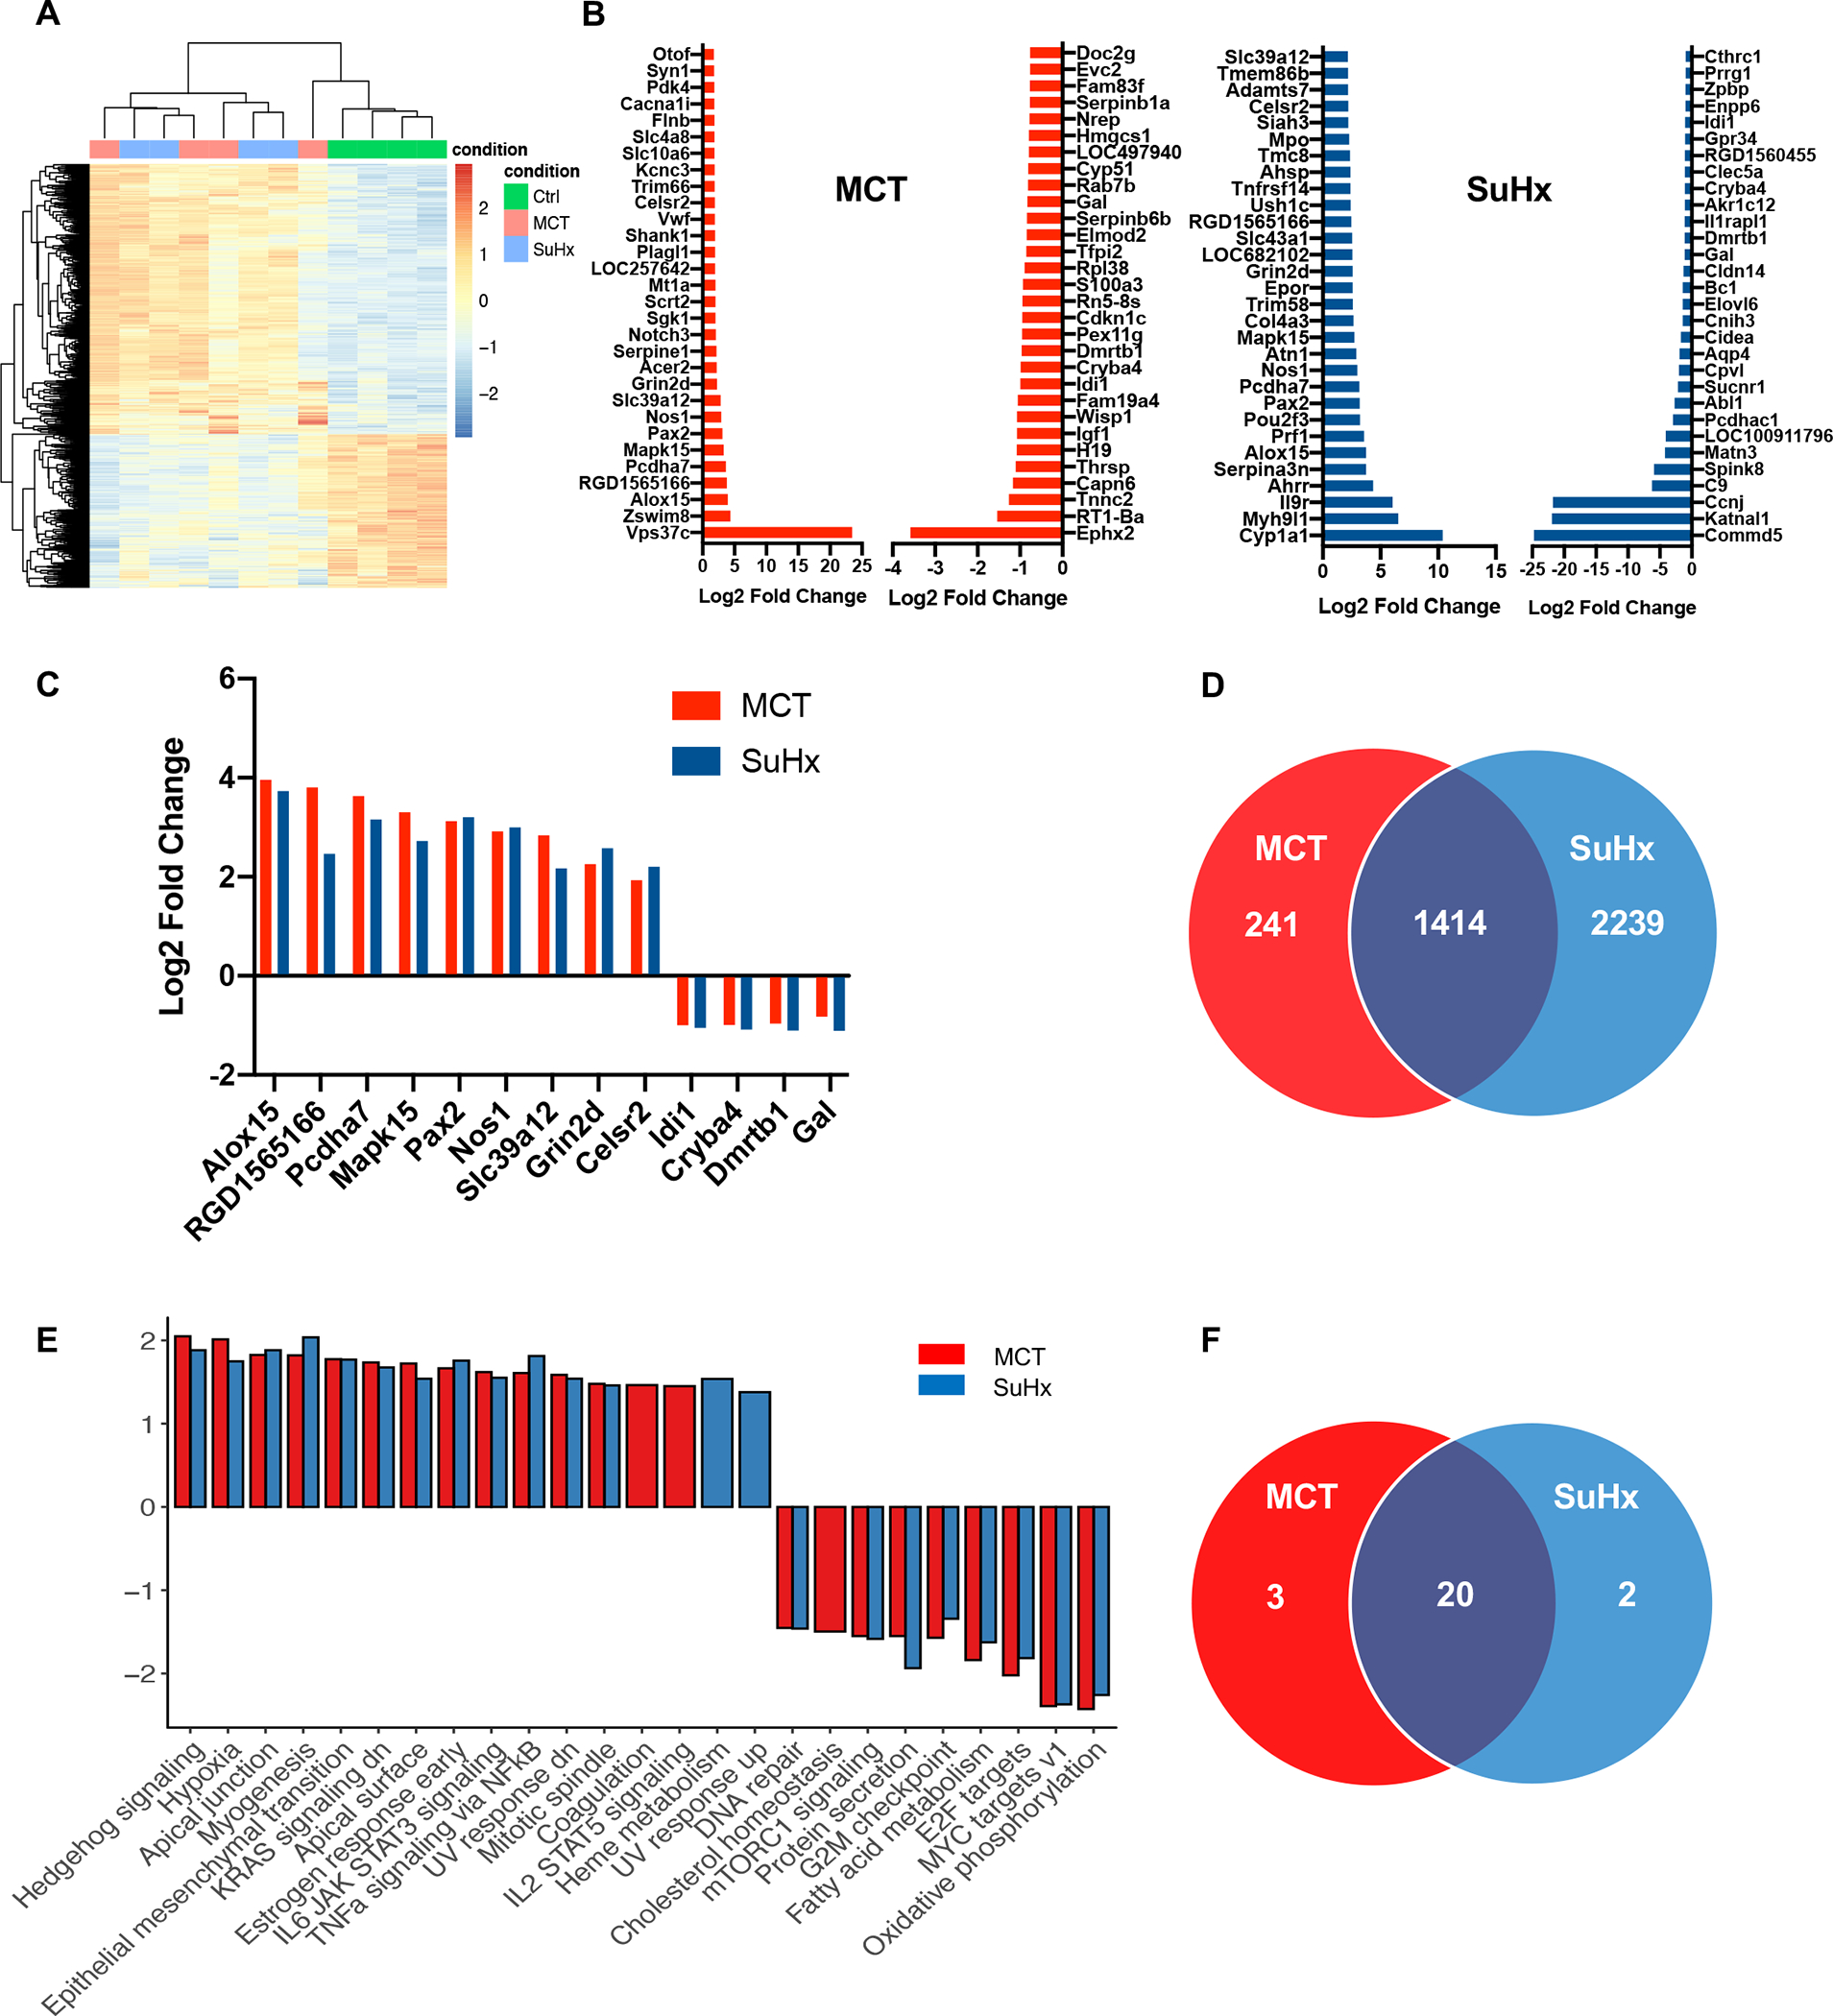
Figure 2. RNA-Seq based analysis of DEG’s and pathway enrichment from thoracic spinal cords of MCT and SuHx rats.

(A) RNA-Seq based heat map showing DEGs from thoracic spinal cord tissue in CTRL (green), MCT (red) and SuHx (blue) groups. (B) Top 30 up-regulated and down-regulated significant DEGs between MCT vs. CTRL and SuHx vs. CTRL. (C) Top common significantly upregulated genes from top 30 DEGs between MCT vs. SuHx (9) and Top common significantly downregulated genes (4) from top 30 DEGs between MCT vs. SuHx (D) Venn diagram showing significant DEGs (based on FDR<0.05) and their overlap in MCT (red) and SuHx (blue) groups. (E) Bar plot showing normalized enrichment scores (NES) for Hallmark pathways derived from Gene Set Enrichment Analysis (GSEA). For GSEA, differentially expressed genes between SuHx or MCT vs. control were ranked by the Wald statistic derived from DESeq2. Bars in red and blue represent statistically significant (FDR<0.05) pathways in MCT and SuHx, respectively, that are either up- or downregulated. (F) Venn diagram showing significant pathways (based on FDR<0.05) and their overlap in MCT (red) and SuHx (blue) groups compared to control. N=4 per group.
