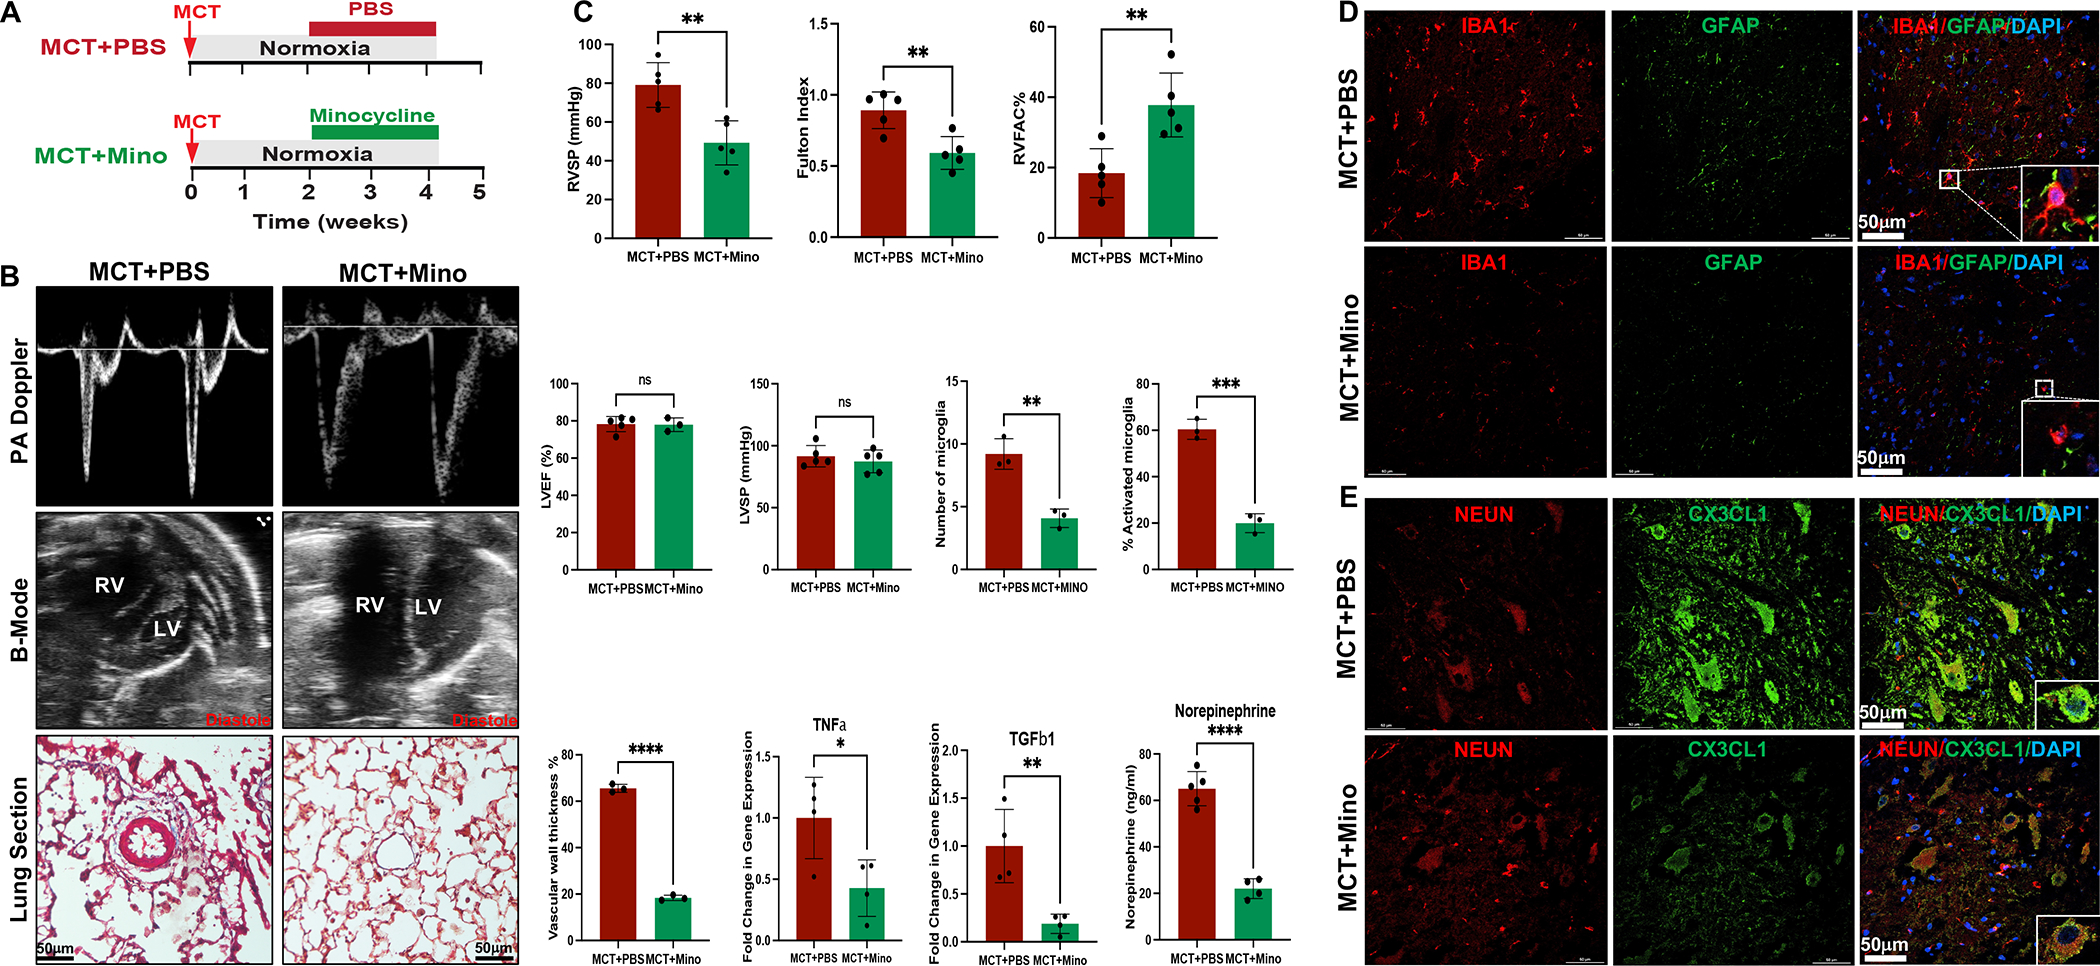
Figure 5. Minocycline rescues MCT-induced PH and RVF by attenuating TSC neuroinflammation and associated sympathoexcitation.

(A) Experimental Protocol. (B) PA Doppler, B-Mode echo and lung cross sections from PBS and Minocycline treated MCT rats. (C) RVSP, Fulton index, RVFAC, LVEF, LVSP, pulmonary vascular (arteriolar) wall thickness, normalized qRT-PCR of pro-inflammatory and apoptotic genes, quantification of number of microglia/HPF and percent activated microglia/HPF in the TSC, and plasma norepinephrine levels measured by ELISA in PBS and Minocycline treated MCT rats. N=3–5 per group. *p<0.05, **p<0.01, ***p<0.001 ****p<0.0001. (D) Representative immunofluorescence images of microglial marker Iba1 (Red), astrocytic marker GFAP (Green) and DNA marker DAPI (Blue) in the TSC of PBS and Minocycline treated MCT rats. N=3 per group. (E) Representative immunofluorescence images of neuronal marker NeuN (Red), chemokine Cx3Cl1 (Green) and DAPI (Blue) in the TSC of PBS and Minocycline treated MCT rats. N=3 per group.
