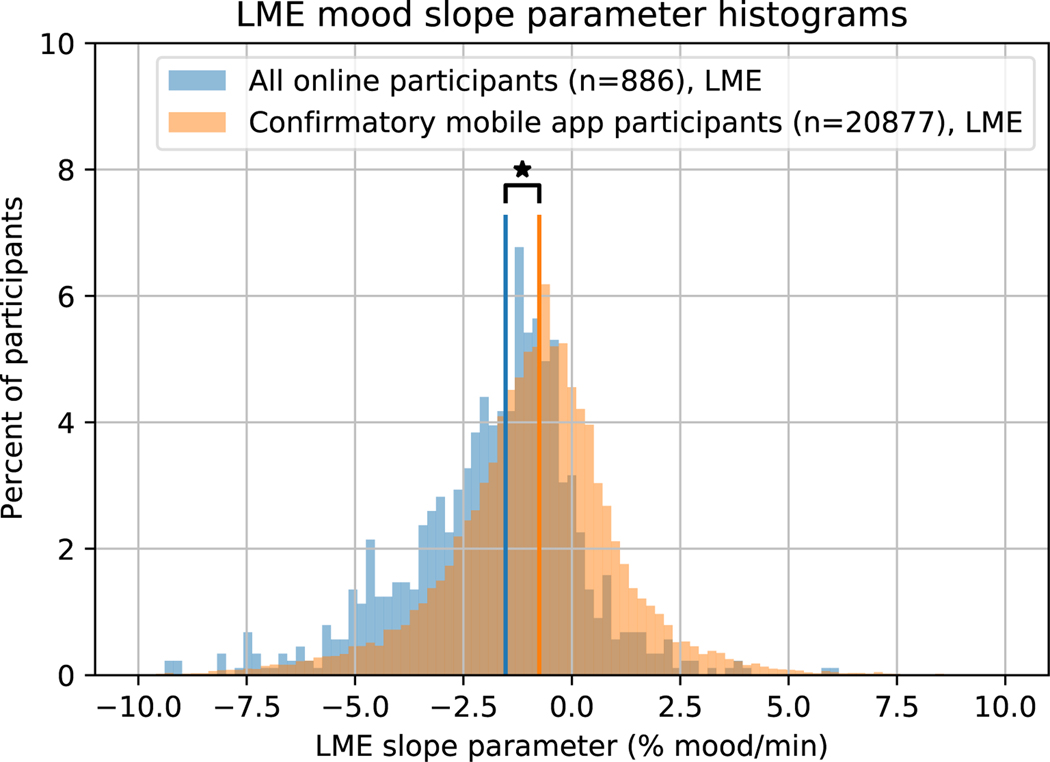
Figure 3:
Individual subject LME slope parameters for online participants (blue) and mobile app participants (orange). The online participants had slopes below zero on average (Mean ± SE = −1.89 ± 0.185 %mood/min, t864 = −10.3, p < 0.001), as did the mobile app participants (Mean ± SE = −0.881 ± 0.0613 %mood/min, t22804 = −14.4, p < 0.001). Mood drift was significantly less negative in the mobile app participants (median=−0.752, IQR=2.10 %mood/min) than in the online participants (median=−1.53, IQR=2.34 %mood/min, 2-sided Wilcoxon rank-sum test, W21761 = −14.5, p < 0.001). Vertical lines represent group medians. Stars indicate p < 0.05.]

