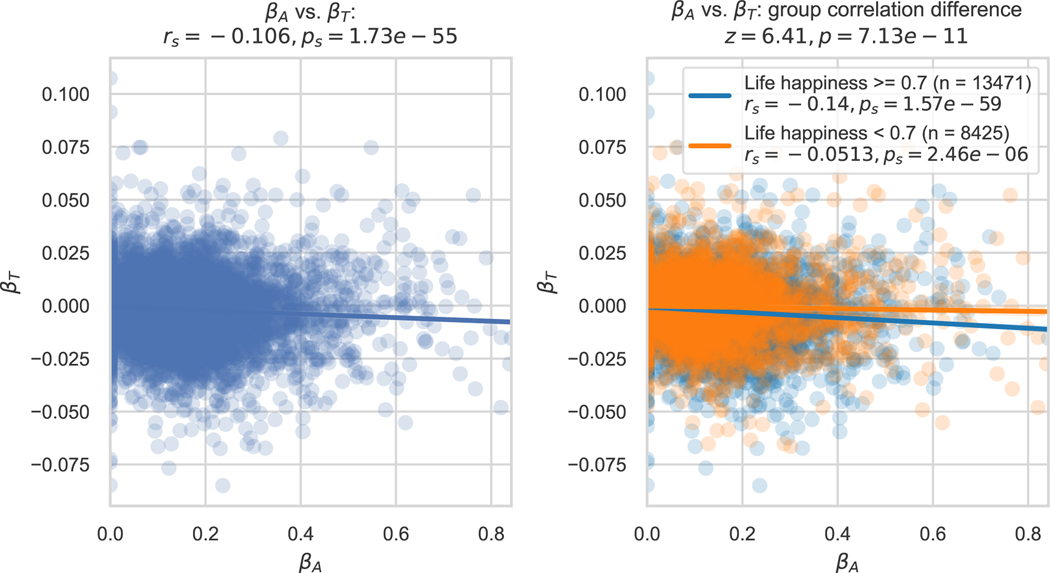
Figure 4:
Individual differences in sensitivity to the passage of time relate to other individual differences in the mobile app cohort. The computational model’s time sensitivity parameter βT for each participant in the mobile app cohort is plotted against that participant’s reward sensitivity parameter βA (left). rs and ps denote Spearman correlation coefficient and corresponding P value. When grouped by life happiness, participants with happiness at or above the median had a stronger βT − βA anticorrelation than participants with happiness below the median (right). Each dot is a participant (n=21,896). Each line is a linear best fit, and patches show the 95% confidence interval of this fit. The group difference in Spearman correlations was statistically confirmed using a z statistic. P values shown are 2-sided with no correction for multiple comparisons.

