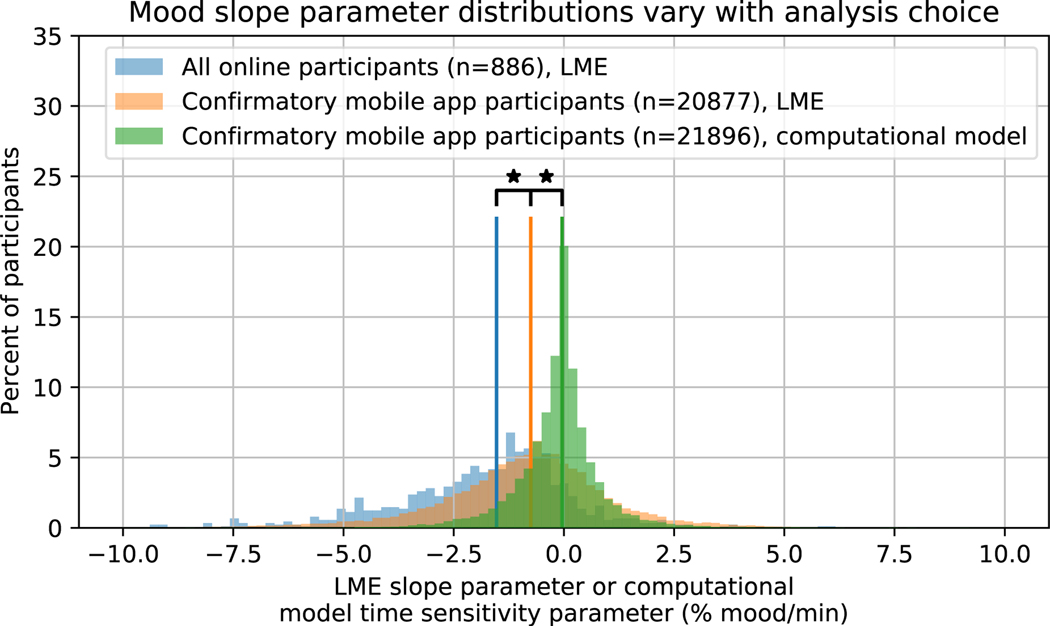
Extended Data Fig. 2.
Mood slope parameter distributions vary with analysis choice
Histogram of the LME mood slope parameters for the online cohort (blue) and the confirmatory mobile app cohort (orange), along with the computational model time sensitivity parameter for the confirmatory mobile app cohort (green). Mobile app participants with outlier task completion times were excluded from the LME analysis (see Methods). Note that the use of LME modeling to analyze the mobile app data significantly lowered the distribution of slopes compared to when the computational model was used (median = −0.752 vs. −0.0408, IQR= 2.10 vs. 0.764 %mood/min, 2-sided Wilcoxon rank-sum test, W42771 = −54.2, p<0.001), but the LME slopes from the mobile app were still significantly greater than those of the online cohort (median = −1.53 vs. 0.752, IQR = 2.34 vs. 2.1 %mood/min, 2-sided Wilcoxon rank-sum test, W21761 = 14.5, p<0.001). Vertical lines represent group medians. Stars indicate p<0.05. P values were not corrected for multiple comparisons.

