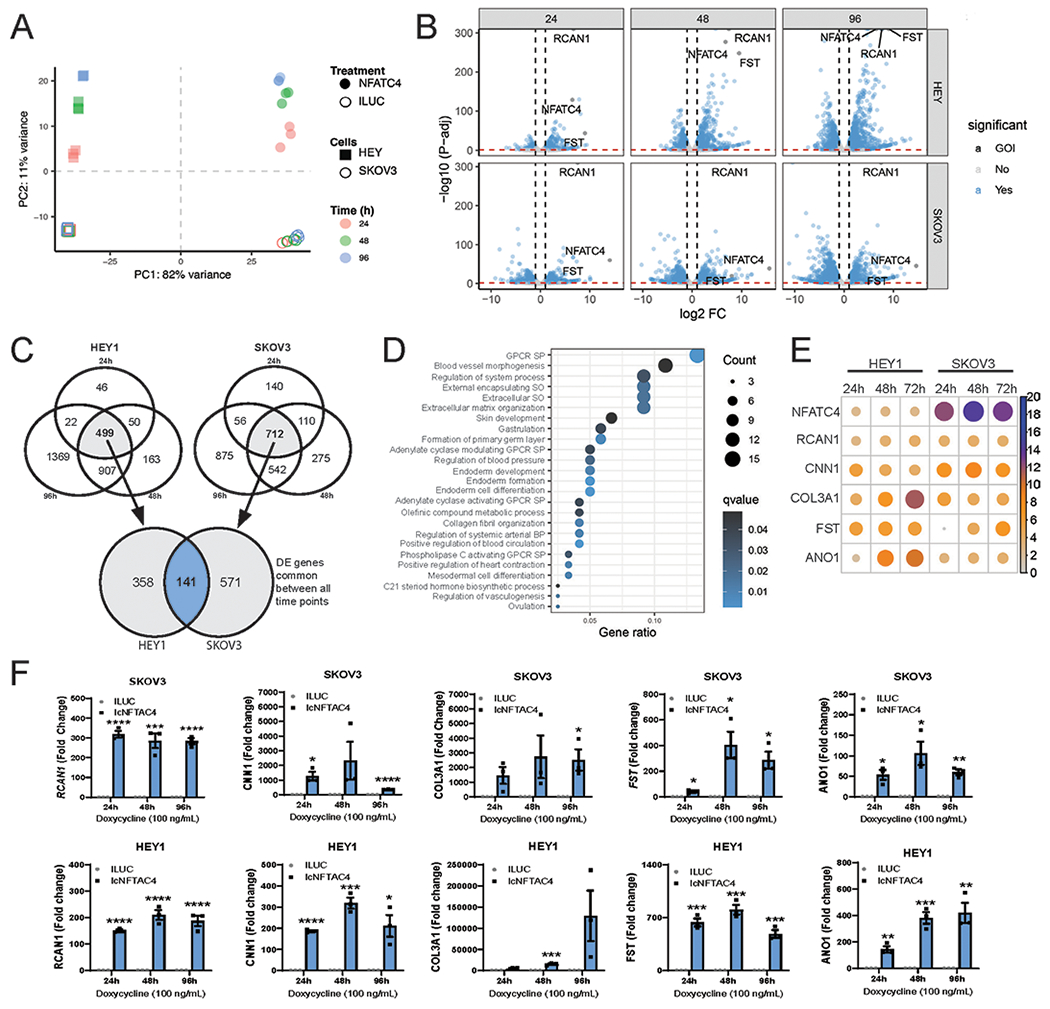
Figure 1. RNA-sequencing of SKOV3 and HEY1 cells overexpressing NFATC4.

HEY1 and SKOV3 cells expressing NFATC4, or luciferase control were treated with 100 ng/mL doxycycline for 24h, 48h and 96h before RNA sequencing. A. Principal component analysis (PCA) of HEY1 and SKOV3 RNA-seq data sets. B. Volcano plots of differential gene expression between SKOV3 and HEY1 cell lines expressing NFATC4 compared to the Luciferases control. C. Venn Diagram demonstrating the number of common genes upregulated in each cell line at each time point compared with the luciferase control. D. Gene Ontology analysis of the top upregulated pathways following NFACT4 activation. G-protein couple receptor (GPCR) signaling pathway (SP) structural organization (SO) E. Bubble plot displaying the top 6 upregulated genes (log2 fold change) F. qPCR validation of the NFATC4 and the top five most upregulated mRNAa (RCAN1, CNN1, COL3A1, FST and ANO1) in the NFATC4 cells vs Luciferases control. **P<0.01, ***P<0.001.
