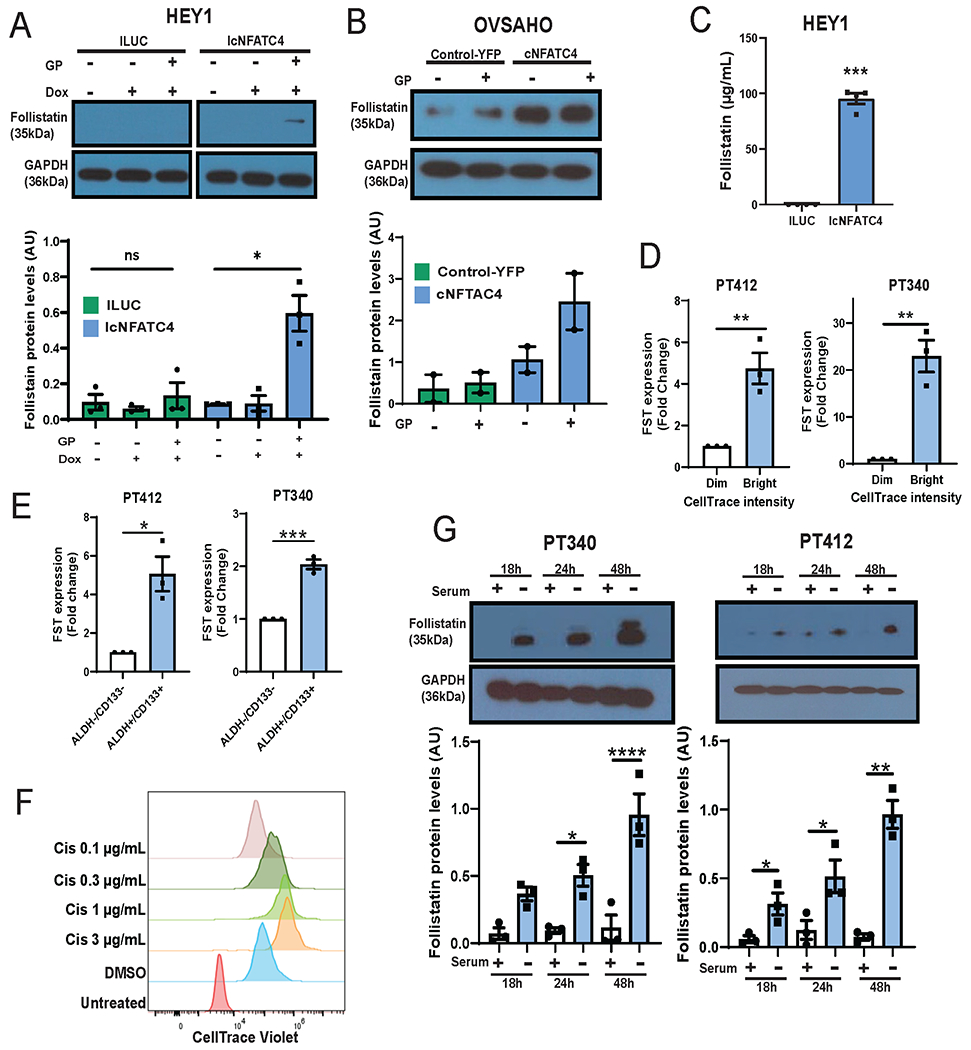
Figure 2. NFATC4 overexpression, result in a significant increase in FST protein levels and secretion.

Immunoblotting for NFAT3 and FST protein levels in HEY1 (A) and OVSAHO (B) cells expressing an inducible or transient NFATC4 expression construct, respectively. Cells were treated with GolgiPlug (GP) for 4 h to retain secreted proteins. C. ELISA of FST section from HEY1 cells expressing ILUC or NFATC4 treated with Dox for 72h. D. FST mRNA expression in primary ovarian cancer cell lines (PT340, PT412) sorted based on CellTrace Violet retention. Bright=slowly diving, Dim=rapidly dividing. E. FST mRNA expression in PT340 and PT412 cells FACS sorted for CD133+/ALDH+ CSC populations and CD133−/ALDH− bulk cells. F. Flow cytometry histograms of CellTrace Violet retention in PT340 cell treated with various concentrations of cisplatin. G. FST protein levels in PT340 and PT412 cells grown in the presence or absence of serum for 18h, 24h or 48h. *P<0.05, **P<0.01, ***P<0.001 ****P<0.0001.
