
Figure 4. Chemotherapy increases FST expression and secretion preferentially in quiescent cancer cells.
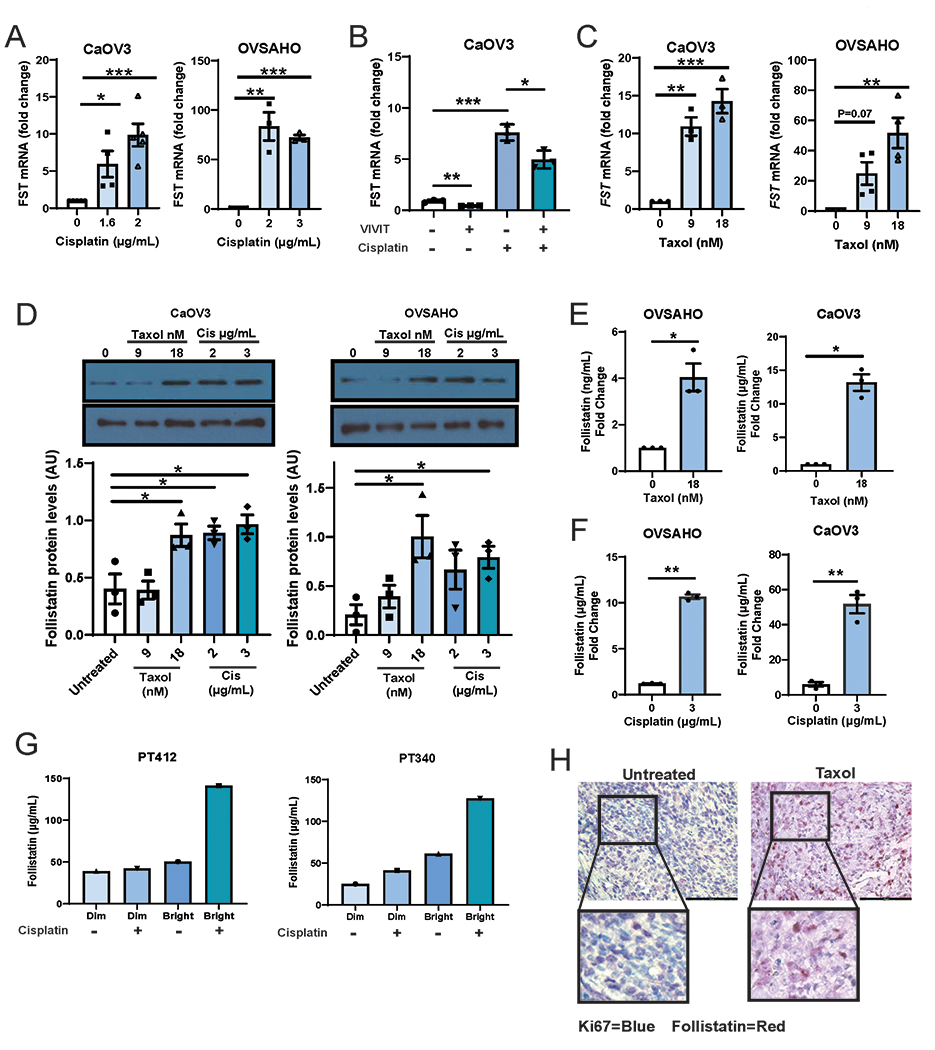
qPCR of FST expression in CaOV3 and OVSAHO cells treated with the indicated doses of (A) cisplatin or (C) Taxol. B. qPCR of FST mRNA expression in CaOV3 cells are treated with cisplatin (2μg/mL) without or with VIVIT (an NFAT inhibitor). C. Immunoblotting and densitometry of FST protein levels in CaOV3 and OVSAHO cells treated with various doses of cisplatin or Taxol. ELISA for FST protein in CaOV3 and OVSAHO cell culture media following treatment with (D) Taxol or (E) Cisplatin. F. FST ELISA of CellTrace Violet sorted Dim (rapidly dividing) and Bright (slowly diving) patient cell populations treated +/− cisplatin. G. IHC images of HGSOC mouse xenografts treated with or without taxol and stained with both Ki67 (Forangi Blue) and FST (Fast Red). *P<0.05, **P<0.01, ***P<0.001, ****P<0.001.