
Figure 4-. Evidence for a hypoperfusion/hypoxic state in the hippocampus of HF rats.
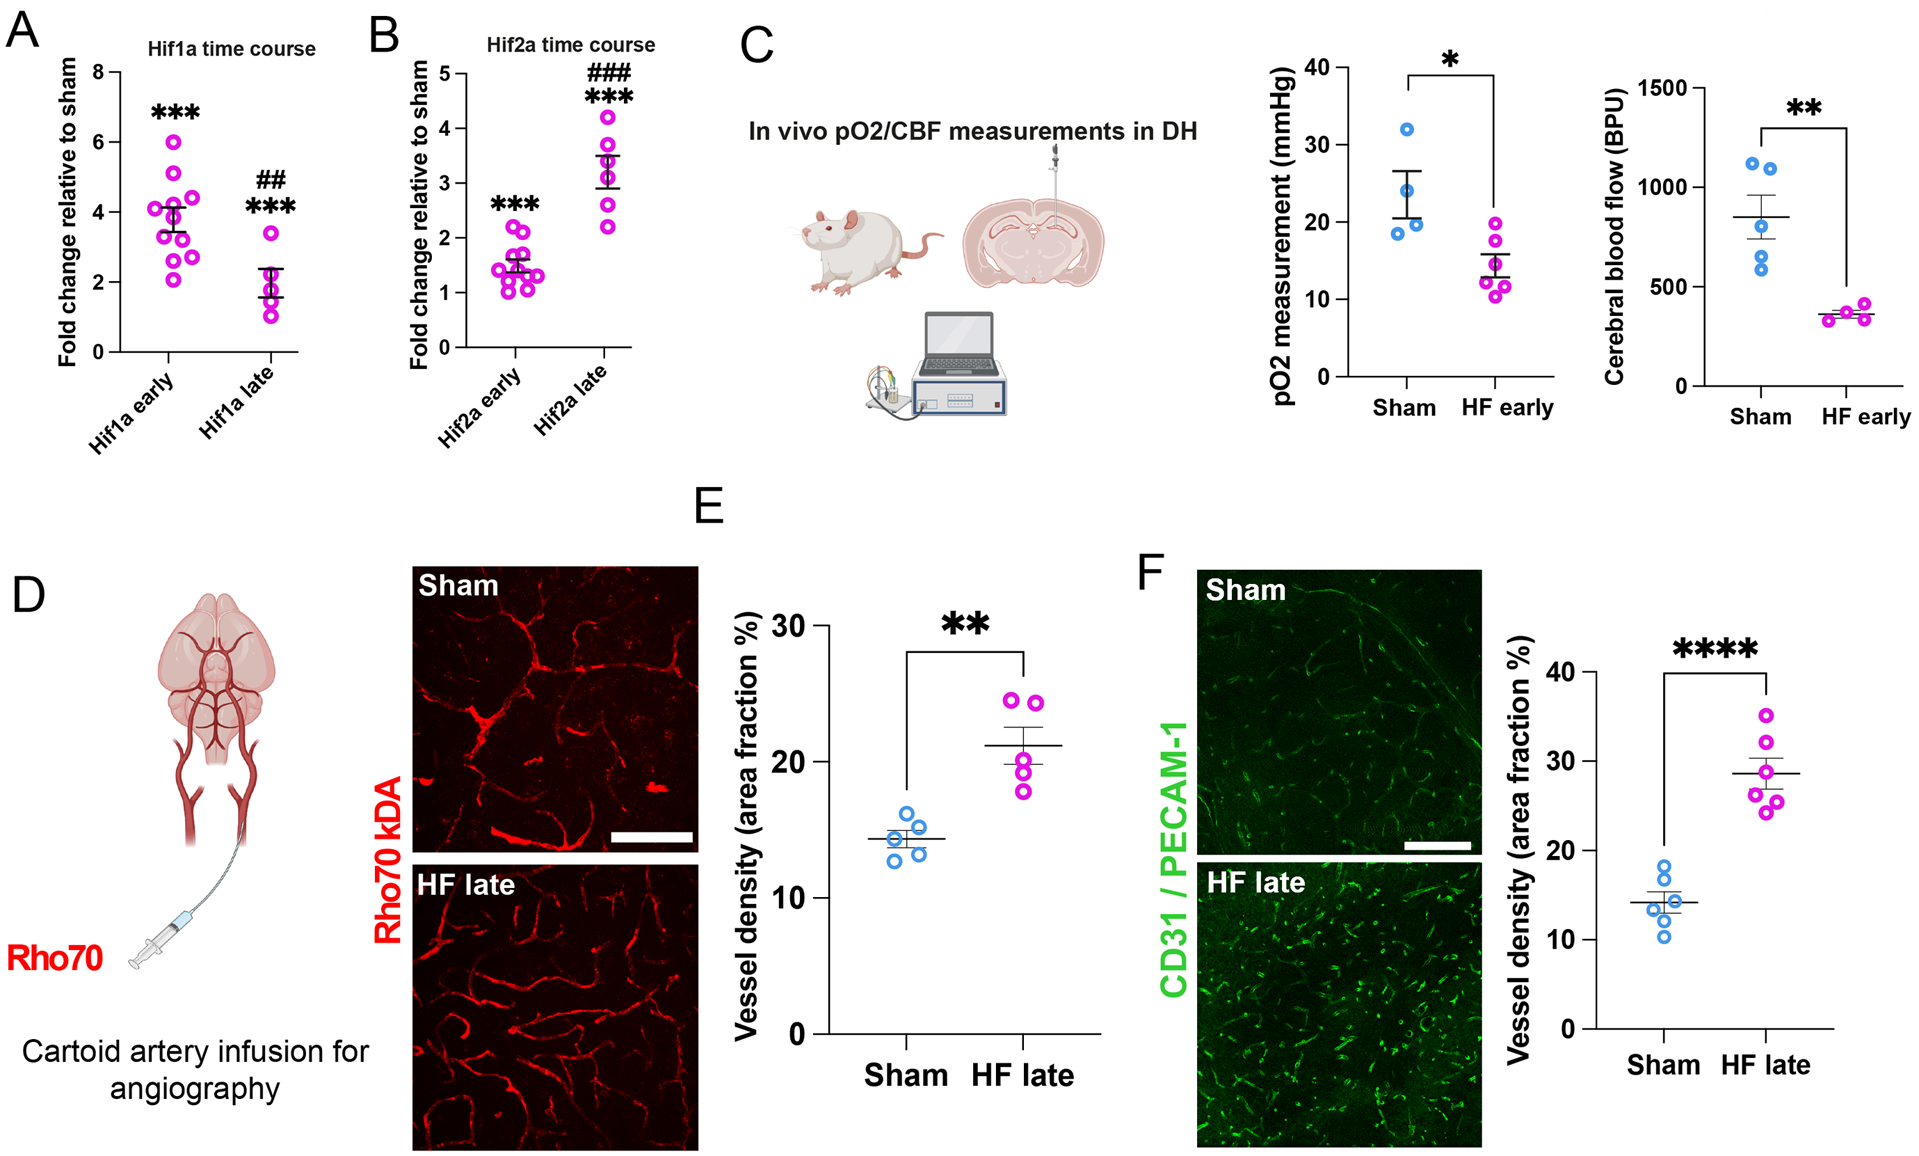
A Changes in hypoxia markers Hif-1α and (B) Hif-2α mRNA in the DH at early and late HF stages relative to Sham (n=5 /group). C Schematic depiction of in vivo measurement of pO2 and cerebral blood flow (CBF) in the DH. HF rats display lower basal hippocampal pO2 levels (n=4 sham, n=6 HF, left panel) as well as decreased basal CBF (n=5 sham, n=4 HF, right panel). D Schematic depiction of angiography via intra-carotid infusion of Rho70 dye. Rho70-labeled blood vessels within the DH of sham and HF rats. E HF rats display significantly increased vessel density. F Confocal images show vascular CD31/PECAM-1 staining in the DH of sham and HF. Note the significantly increased vascular density in HF compared to sham rats. Scale bar 100μm (e) and 200μm (f). p<0.05*, and p<0.001*** vs sham; p<0.01## and p<0.0001### vs HF early.