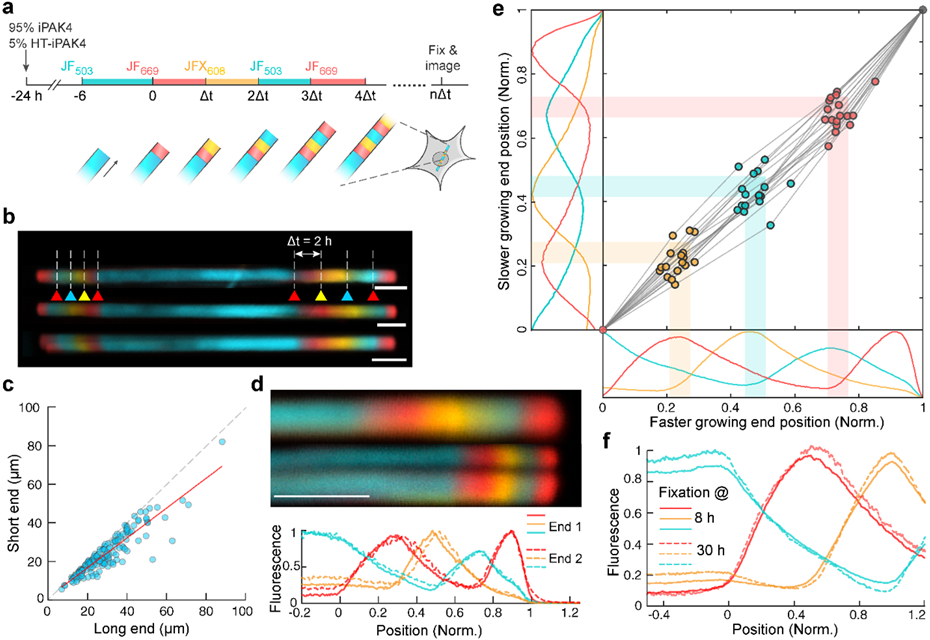
Figure 2. iPAK4 fibers can be sequentially labeled with different dyes.

a, Scheme for multi-color labeling of intracellular iPAK4 fibers. b, Images of iPAK4 fibers labeled with four dye transitions on each end. Triangles indicate times of dye addition. Blue: JF503, Red: JF669, Yellow: JFX608. Scale bars 5 μm. c, Comparison of the growth rate on the two ends after one dye switch. The long end and short end correspond to the faster and slower growing end, respectively (N = 153 fibers). The growth rate on the slower-growing end was 0.77 ± 0.05-fold lower than on the faster-growing end (95% C.I.). d, Comparison of two ends of a single fiber. Top: images of the two ends. In this case, the fiber split at one of its ends, an occurrence in approximately 10% of fibers. Bottom: quantification of the fluorescence traces in the two ends, with position normalized to the locations of the first JF669 addition and the end of the fiber. Scale bar 5 μm. e, Comparison of dye transition points on the faster and slower-growing fiber ends. The scatter plot shows the positions of the JFX608, JF503 and JF669 transitions normalized relative to the first JF669 addition (at position 0) and the end of the fiber (at position 1). The plots show the mean fluorescence profiles of N = 17 fibers. Here the number of fibers was set by the requirement for in-focus, unobstructed views of both ends of the fibers. f, Mean fluorescence profiles of fibers exposed to the same sequence of dyes and then grown for different amounts of time (N = 22 fixed at 8 h, 12 fixed at 30 h). The overlap of these profiles indicates negligible monomer exchange over 22 h.
