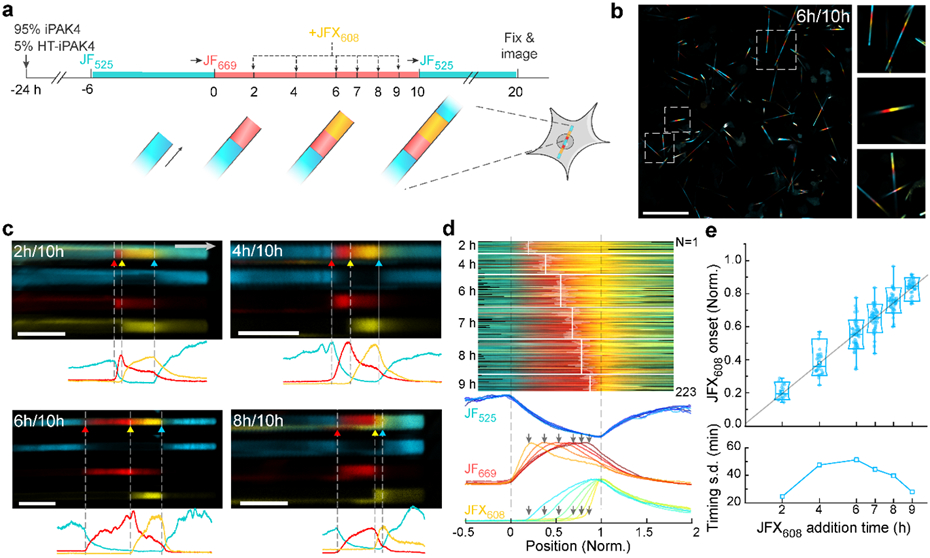
Figure 3. iPAK4 fibers report timing of intracellular events.

a, Experimental design for testing the precision with which addition of JFX608 could be determined relative to timestamps from addition of JF669 (at t = 0) and JF525 (at t = 10 h). b, Low-magnification (left) and magnified (right) images of iPAK4 fibers in HEK cells. Scale bar 100 μm. c, Top: Images of fibers with JFX608 addition at t = 2, 4, 6, and 8 h. Bottom: fluorescence line profiles. Scale bars 10 μm. d, Top: fluorescence profiles of N = 223 fiber ends with JFX608 addition at different timepoints. The profile lengths have been normalized to line up the timestamps at t = 0 and 10 h. Bottom: Mean fluorescence traces in each of the three dye color channels, for all times of JFX608 addition. e, Top: positions of the JFX608 onset as a function of dye addition time. Bottom: standard deviation in the inferred timing of JFX608 addition for each population of fibers. Lower and upper bounds of the box plot: 10th and 90th percentile; lower and upper whiskers: minimum and maximum; squares: mean; center lines: median. All data points are displayed.
