
Figure 5. Protein ticker tape recordings of cFos activation in neurons.
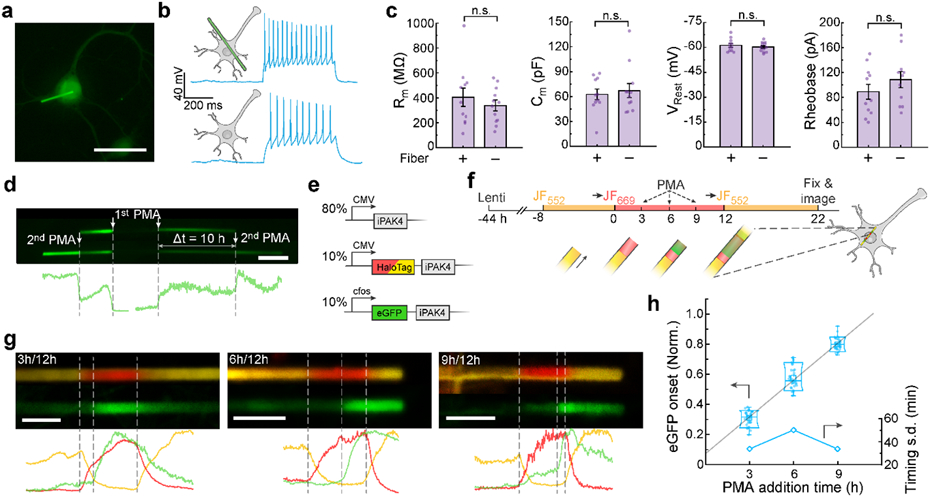
a, Image of a cultured neuron expressing lentiviral CMV::iPAK4 (90%) and CMV::eGFP-iPAK4 (10%). Scale bar: 50 μm. b, Representative patch clamp recordings in neurons with or without an iPAK4 fiber. Spikes were evoked by a current injection of 100 pA. c, There were no significant differences between neurons with or without fibers in membrane resistance (404 ± 73 MΩ vs 339 ± 43 MΩ, p = 0.43), membrane capacitance (63 ± 6 pF vs 67 ± 9, p = 0.67), resting potential (−61.2 ± 1.2 mV vs −60.2 ± 0.8 mV, p = 0.48), or rheobase (89 ± 12 pA vs 109 ± 13 pA, p = 0.27, N = 11 neurons with fibers, 12 neurons without). Error bars show mean ± s.e.m.. Two-sided Student’s t-test was employed for data comparison. d, Fiber in a neuron expressing lentiviral CMV::iPAK4 (90%) and cFos::eGFP-iPAK4 (10%). The top image shows the fiber after a first PMA addition, the bottom image shows the same fiber after a second PMA addition. Scale bar 5 μm. e, Genetic constructs for recording time-tagged cFos activation in neurons. f, Experimental protocol for recording time-tagged cFos activation in neurons. Transitions to JF669 at t = 0 and to JF552 at t = 12 h provided fiducial timestamps. cFos was activated via addition of PMA at t = 3, 6, or 9 h. g, Top: representative images of fibers with PMA addition at t = 3, 6, or 9 h. Bottom: fluorescence line profiles. Scale bar 5 μm. h, Normalized positions of eGFP onset relative to fiducial timestamps at t = 0 and 12 h. Lower and upper bounds of the box plot: 10th and 90th percentile, respectively; lower and upper whiskers: minimum and maximum, respectively; squares: mean; center lines: median. The linear fit has a y-intercept of ca. 1.0 h. All data points are displayed.