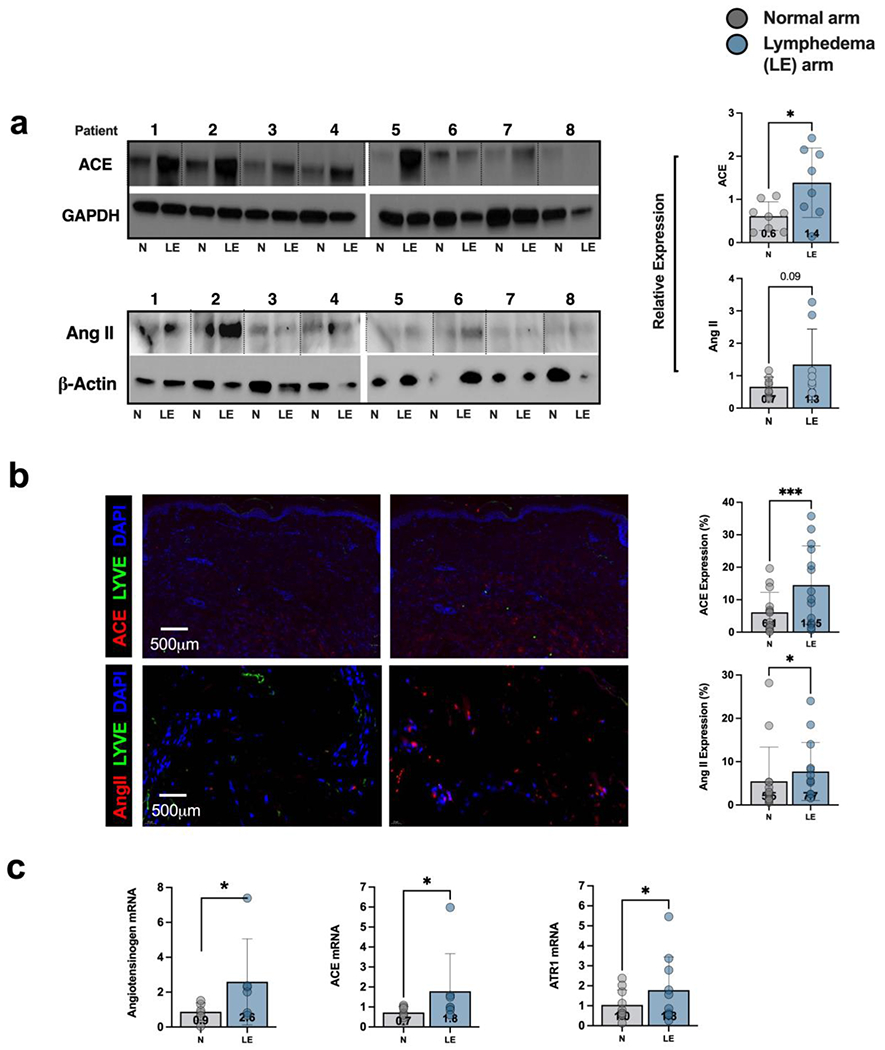
Figure 1. Expression of ACE is increased in clinical lymphedema skin biopsy samples.

a) Western blot analysis and quantification of ACE and Ang II expression in matched tissue obtained from the lymphedematous (LE) and contralateral normal (N) upper extremities of patients with breast cancer-related lymphedema (BCRL). Patient number is shown above each matched pair and separated by dotted lines. Each dot in the plots represents the average of two separate western blots. Data are mean ± standard deviation. Statistical analysis was performed using a matched t-test (*p<0.05).
b) Representative immunofluorescent images (left) and quantification (right) of ACE and Ang II in matched biopsies obtained from the lymphedematous (LE) and normal (N) upper extremities of patients with BRCL. Each dot in the graph represents the average of 2 high powered views (HPF; 40x) for each patient. Data are mean ± standard deviations. Statistical analysis was performed using a matched t-test (* p<0.05).
c) Gene expression of angiotensinogen, ACE, and angiotensin receptor I (AT1R) in matched biopsies obtained from the lymphedematous (LE) normal (N) upper extremities of patients with BRCL. Each dot in the graph represents the average of qPCR performed in triplicate for each patient and quantified using the delta delta method. Data are mean ± standard deviations. Statistical analysis was performed using a matched t-test on log normalized values (* p<0.05).
