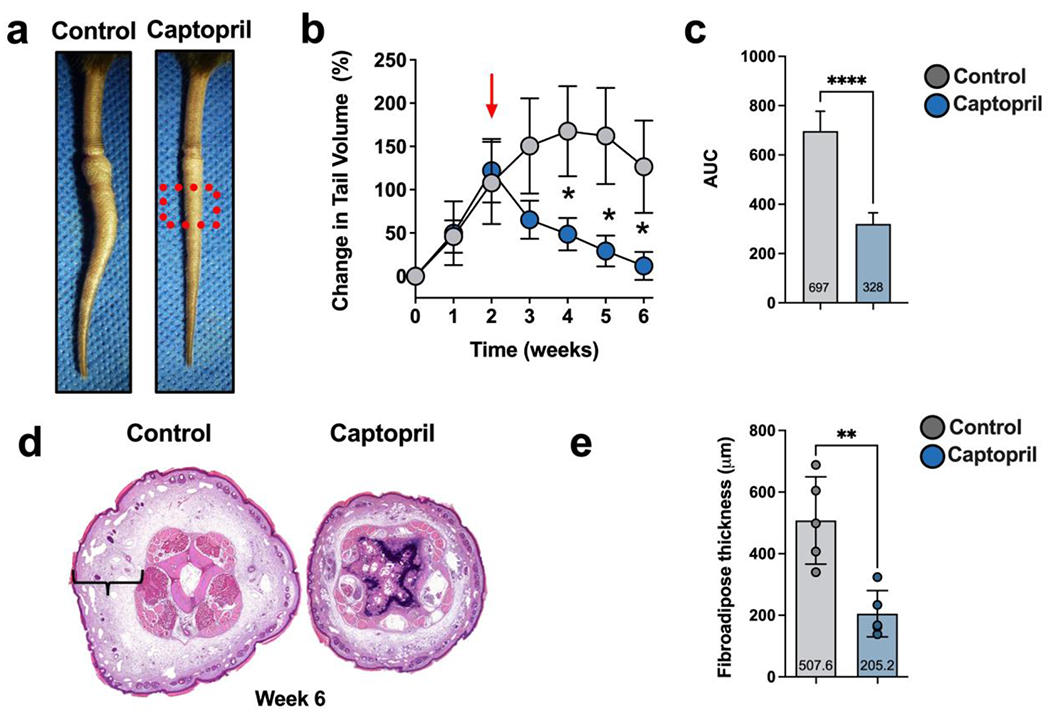
Figure 2. Topical captopril decreases edema and fibrosis in the mouse tail model of lymphedema 6 weeks after surgery.

a) Representative images of tail skin after treatment with control or topical captopril beginning 2 weeks after surgery. The red dotted box is the area analyzed using histology in H&E section shown in Figure 2d and Figures 3 and 4.
b) Quantification of tail volume changes using the truncated cone formula in mice treated with control or topical captopril. The red arrow indicates the time point when treatment was initiated. Statistical analysis was performed using a two-way ANOVA (* p<0.05).
c) Comparison of the area under the curve (AUC) in tail volume graph comparing captopril and control treated mice. Statistical analysis was performed using a t-test(**** p<0.0001).
d) Representative H&E staining of distal tail cross-sections in captopril and control treated mice. Brackets indicate fibroadipose thickness.
e) Quantification of tissue fibroadipose thickness in captopril and control treated mice. Each dot represents the average of 4 measurements for each mouse (n=7) used in the experiment. Data are mean ± standard deviation. Statistical analysis was performed using the Student’s t test (**** p<0.0001).
