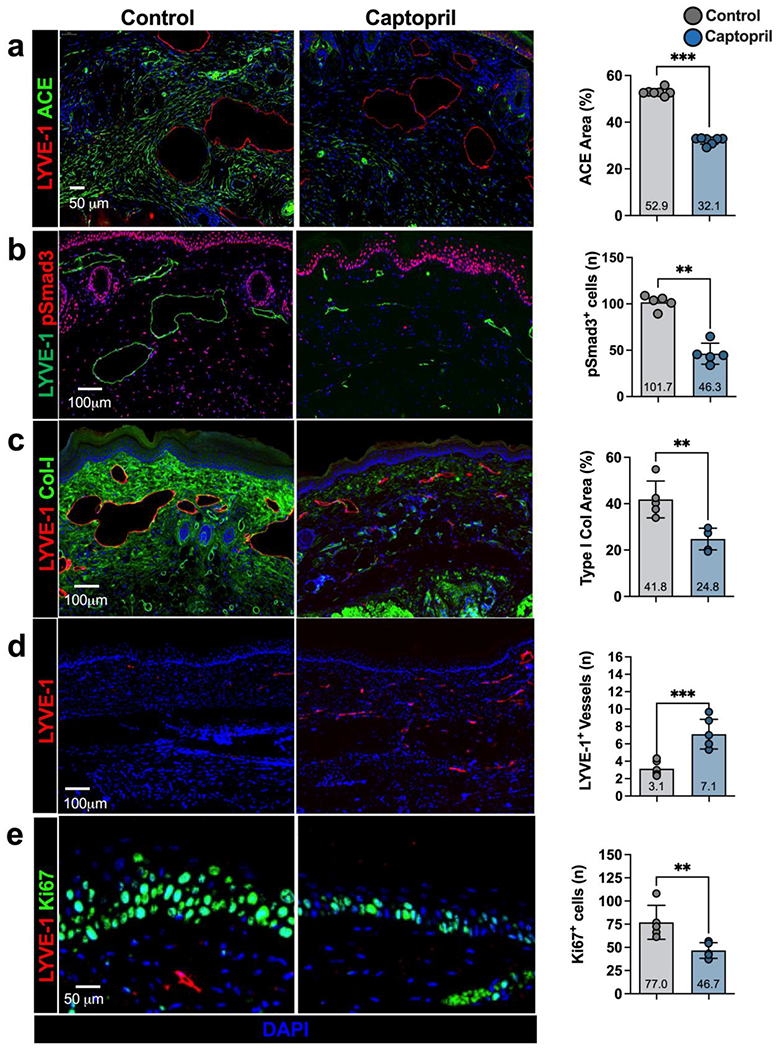
Figure 3. Topical captopril decreases ACE expression, SMAD phosphorylation, fibroadipose deposition, and hyperkeratosis in the mouse tail model of lymphedema.

a-e) Representative immunofluorescent images (left) and quantification (right) of ACE (a), pSmad3 (b), collagen I (Col-I; c), LYVE-1 (d), and Ki67 (e) in captopril and control treated mice 6 weeks after tail surgery. Each dot represents the average of 3 high powered views for each animal used in the analysis (n=7). Data are mean ± standard deviation. Statistical analysis was performed using the Student’s t-test (*p<0.05, **p<0.01, ***p<0.001).
