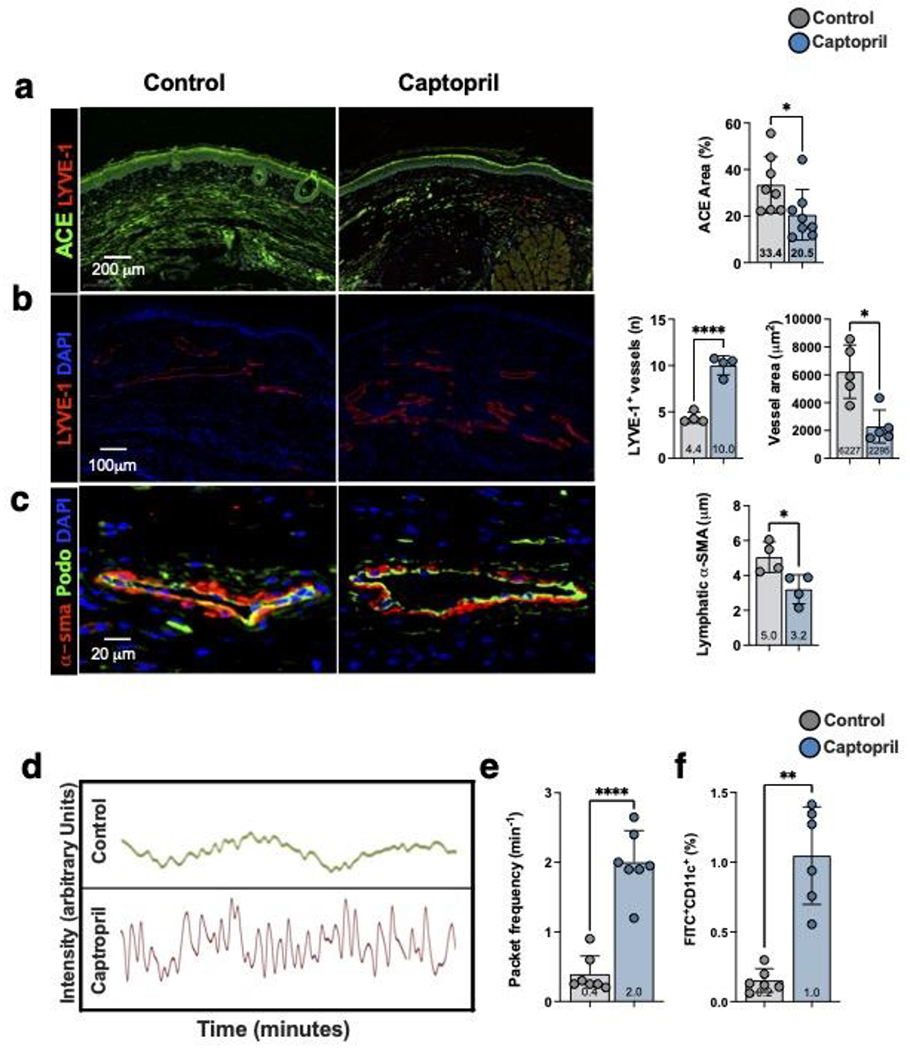
Figure 5. Topical captopril increases lymphangiogenesis and lymphatic function following PLND.

a) Representative immunofluorescent images (left) and quantification (right) of ACE in the skin of captopril or control treated mice 4 weeks after PLND. Each dot represents the average of 3 high power fields per animal (n=8) used in the study. Statistical analysis was performed using the Student’s t-test (*p<0.05).
b) Representative immunofluorescent images (left) and quantification (right) localizing LYVE-1+ lymphatic vessels in the skin of captopril or control treated mice 4-weeks after PLND. Quantification of LYVE-1+ vessel diameter is also shown in the bar graphs on the right. For the lymphatic vessel number, each dot represents the average number of lymphatic vessels in 3 low power fields (10x) per animal (n=4) used in the study. For the lymphatic vessel area, each dot represents the average of all vessels included in the images of 3 low power field per animal (n=5) used in the study. Statistical analysis was performed using the Student’s t-test (*p<0.05, ****p<0.0001).
c) Representative immunofluorescent images localizing podoplanin (Podo) and α-SMA in collecting lymphatic vessels of captopril or control treated mice 4-weeks after PLND (left). Quantification of perilymphatic α-SMA thickness is shown to the right. Each dot represents the average thickness of α-SMA area in 4 quadrants of a collecting lymphatic for each animal (n=4) in the study. Statistical analysis was performed using the Student’s t-test (*p<0.05).
d) Representative graphs depicting changes in near infrared fluorescence (NIR) in a collecting lymphatic vessel over time in captopril or control mice. Each peak represents a packet frequency.
e) Quantification of NIR collecting lymphatic vessel packet frequency in captopril and control treated mice. Each dot represents the average of 3 recordings in each mouse (n=7). Statistical analysis was performed using the Student’s t-test (*p<0.0001).
f) Quantification of dendritic cell trafficking in captopril and control treated mice. FITC-acetone was painted on the distal hindlimb skin and the percentage of FITC+CD11c+ DCs in ipsilateral inguinal lymph nodes was quantified. Each dot represents the average of two flow-cytometry experiments for each mouse (n=6). Statistical analysis was performed using the Student’s t-test (**p<0.01).
