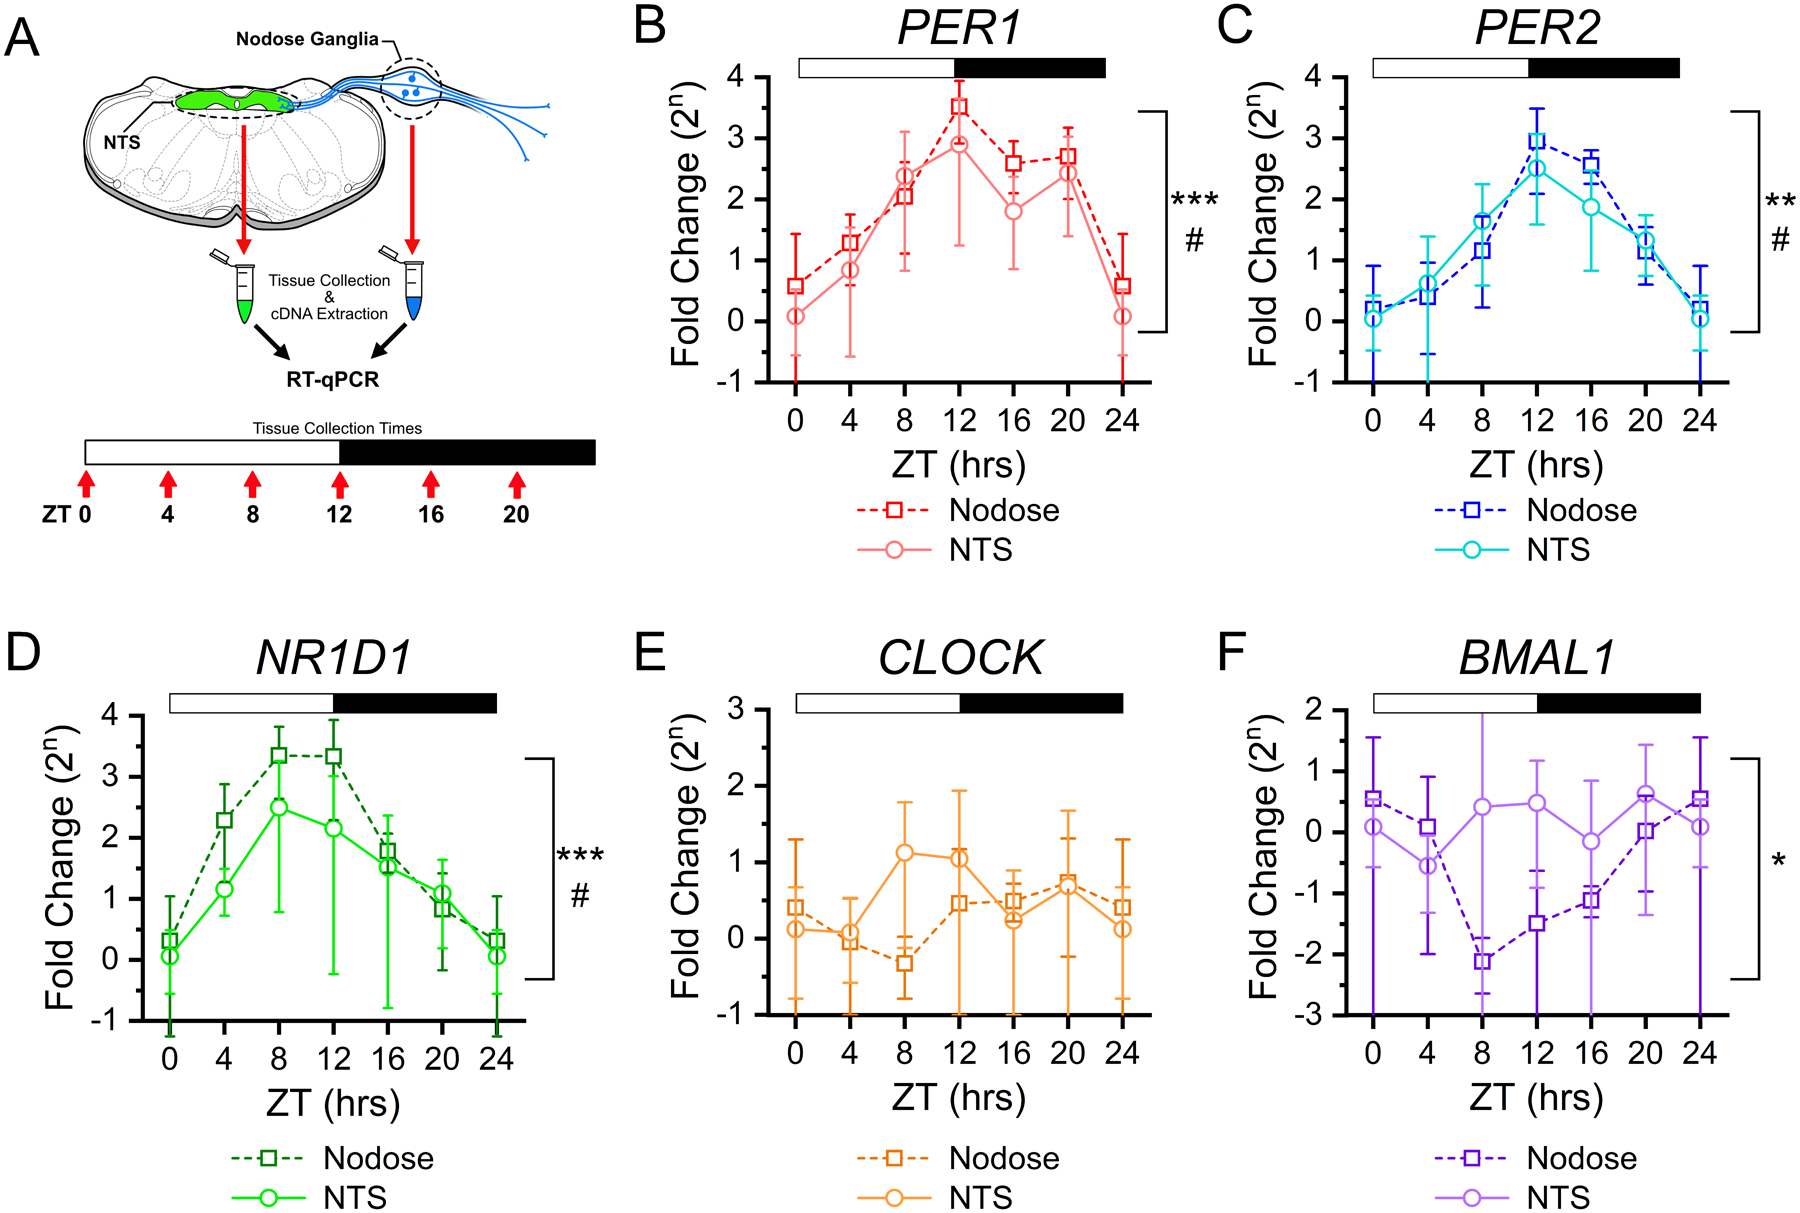
FIGURE 1: Rhythmic clock gene expression in NTS and vagal afferent neurons across time of day.

A) Clock gene expression was determined in the NTS and nodose ganglia using RT-qPCR from tissues taken at six time points throughout the light/dark cycle. For each time point tissue was collected from N = 4 – 5 mice and samples were run in triplicate. Canonical clock gene expression from nodose ganglia (squares) and NTS (circles) show rhythmic changes for B) Per1 (NTS: ANOVA, #P = 0.039; Nodose: ANOVA, ***P < 0.001), C) Per2 (NTS: ANOVA, #P = 0.01; Nodose: Kruskal-Wallis, **P = 0.003), D) Nr1d1 (Rev-erbα) (NTS: Kruskal-Wallis, #P = 0.032; Nodose: Kruskal-Wallis, ***P < 0.001); but not for E) Clock (NTS: ANOVA, P = 0.44; Nodose: ANOVA, P = 0.48), and F) only in nodose tissue, but not NTS, for Arntl1 (Bmal1) (NTS: ANOVA, P = 0.62; Nodose: Kruskal-Wallis, *P = 0.031). ΔΔCt was calculated relative to RN18s and ZT0, with data expressed as a fold-change on a log base 2 scale. All data are plotted as the average ± stdev.
