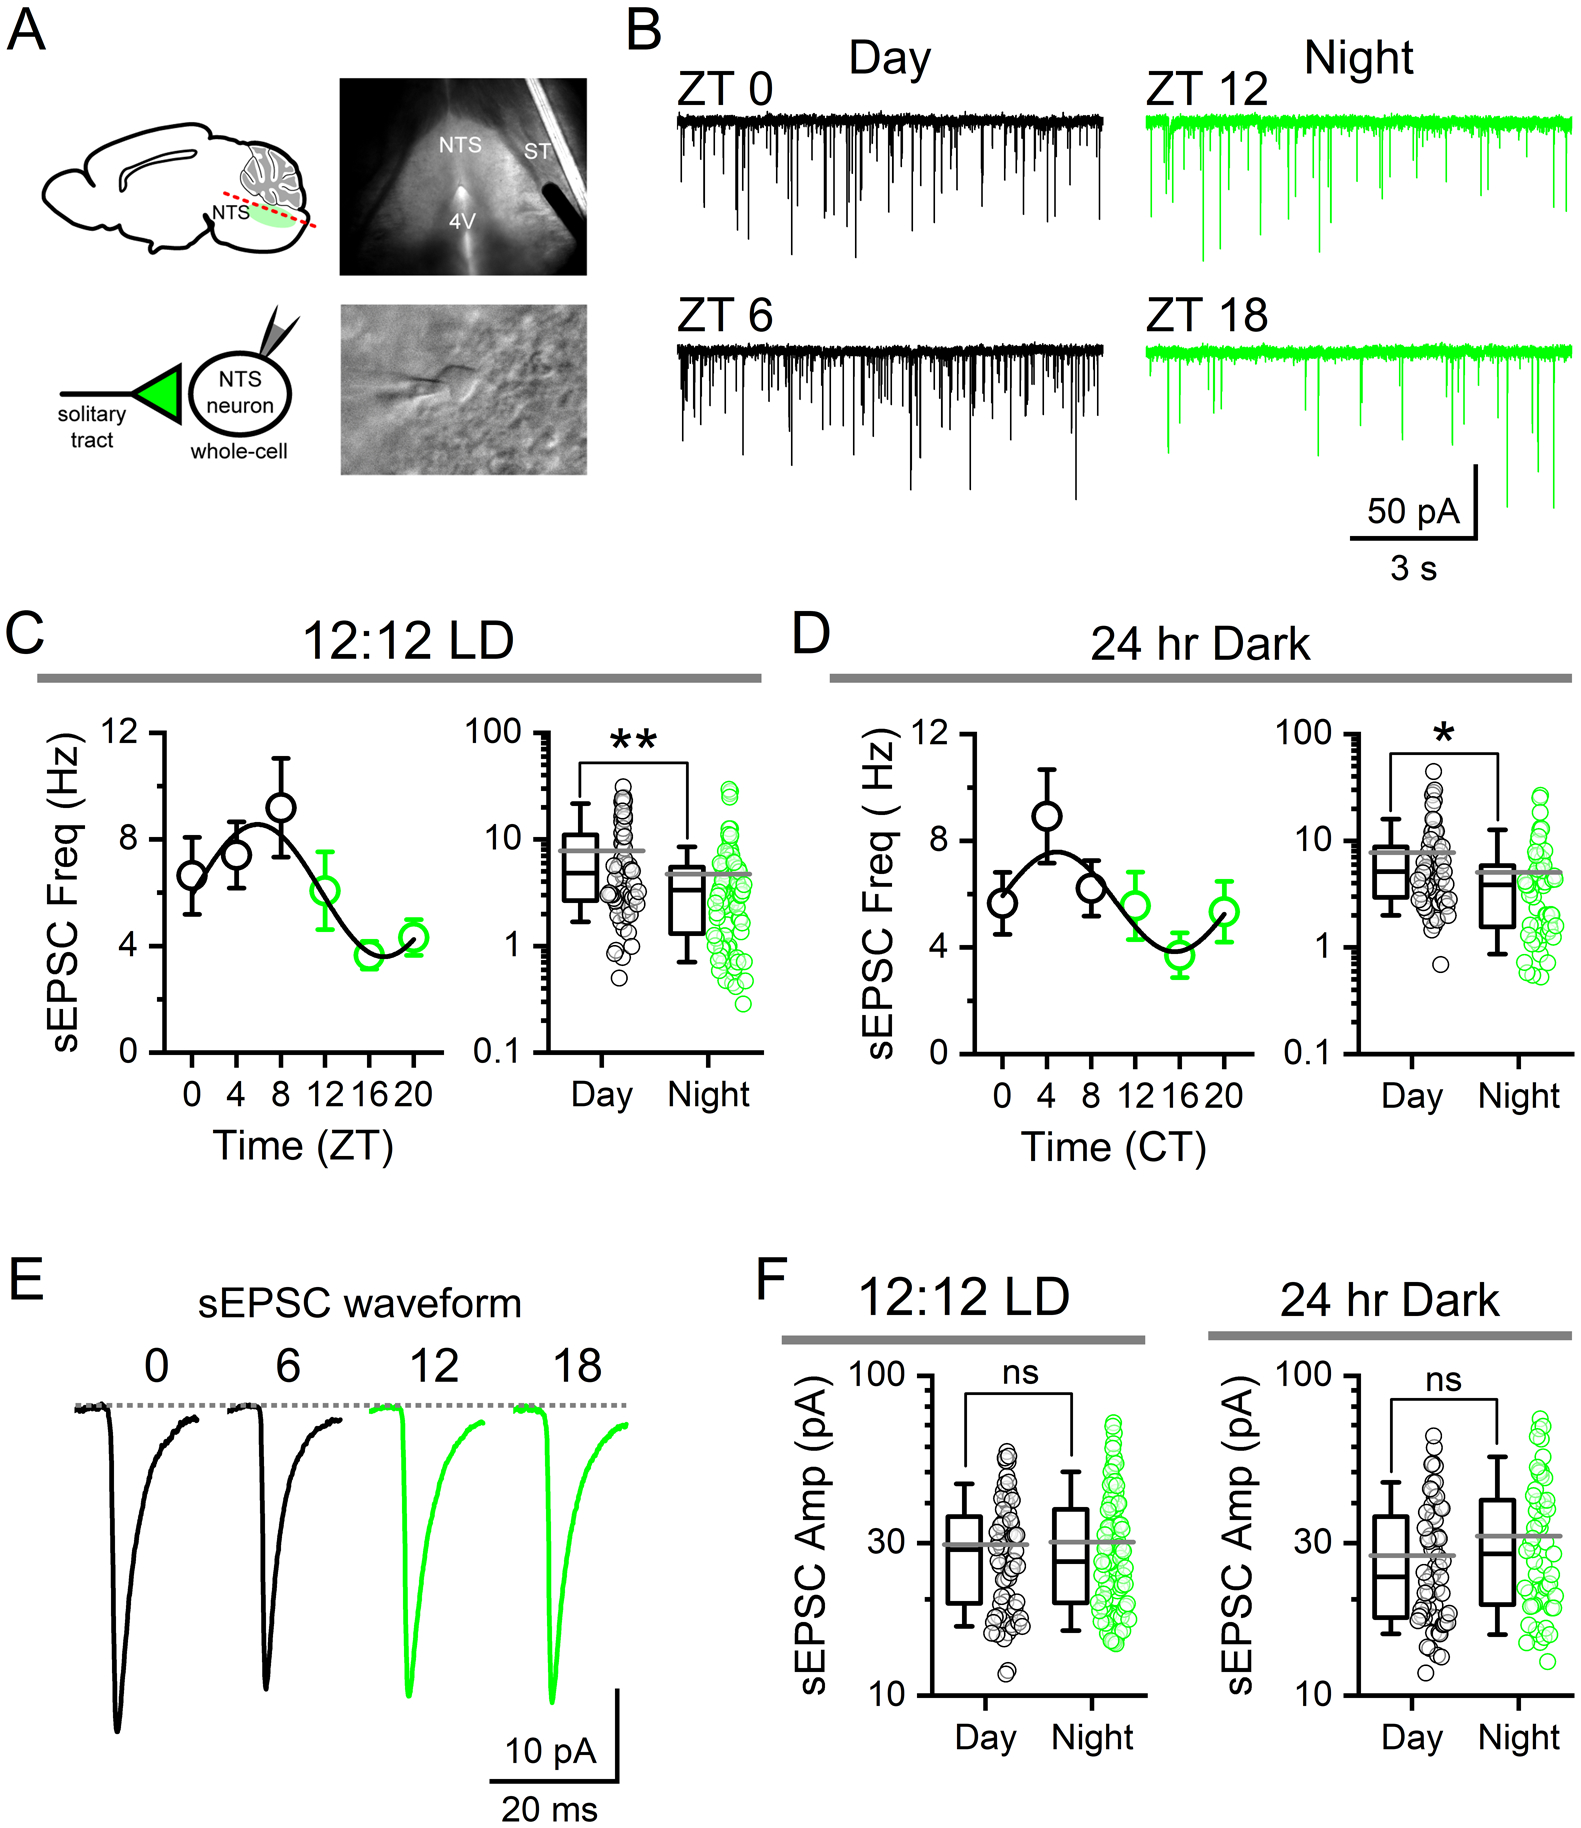
FIGURE 2: Spontaneous glutamate release frequency shows circadian rhythmicity.

A) Infrared-DIC images of a mouse horizontal brain slice (top) and whole-cell recording of a single NTS neuron (bottom) during patch-clamp experiments. NTS, nucleus of the solitary tract; ST, solitary tract; 4V, fourth ventricle. Cells were voltage-clamped at −60 mV. B) Representative current traces showing spontaneous EPSCs (sEPSCs) from recordings in slices taken at one of four time-points throughout the day: ZT 0, ZT 6, ZT 12, and ZT 18. C) Average sEPSC frequency recorded from animals housed under 12:12 LD conditions plotted in four-hour bins across time-of-day showing the change in frequency (left panel, data are plotted as the average ± sem to highlight rhythmicity). Frequency of release was significantly different during the day (ZT 0–12) when compared to the night (ZT 12–24) (right panel) (N = 72 – 92 neurons / 14 mice, Mann-Whitney Rank Sum Test, **P < 0.001). Data are plotted as the average ± stdev and an all-points plot. D) Recordings from mice taken after 24–42 hrs of constant darkness (12:12 DD) maintained rhythmicity of sEPSC frequency independent of light cues. Frequency was significantly higher from cells taken during the respective day (CT 0–12) compared to the dark (CT 12–24) (N = 55 – 61 neurons / 15 mice, Mann-Whitney Rank Sum Test, **P = 0.01). E) Average sEPSC waveforms across time of day. Traces are averages of 100 discrete events from representative recordings. F) There was no significant difference in sEPSC amplitude between day and night in LD (Mann-Whitney Rank Sum Test, P = 0.89) or DD conditions (Mann-Whitney Rank Sum Test, P = 0.14).
