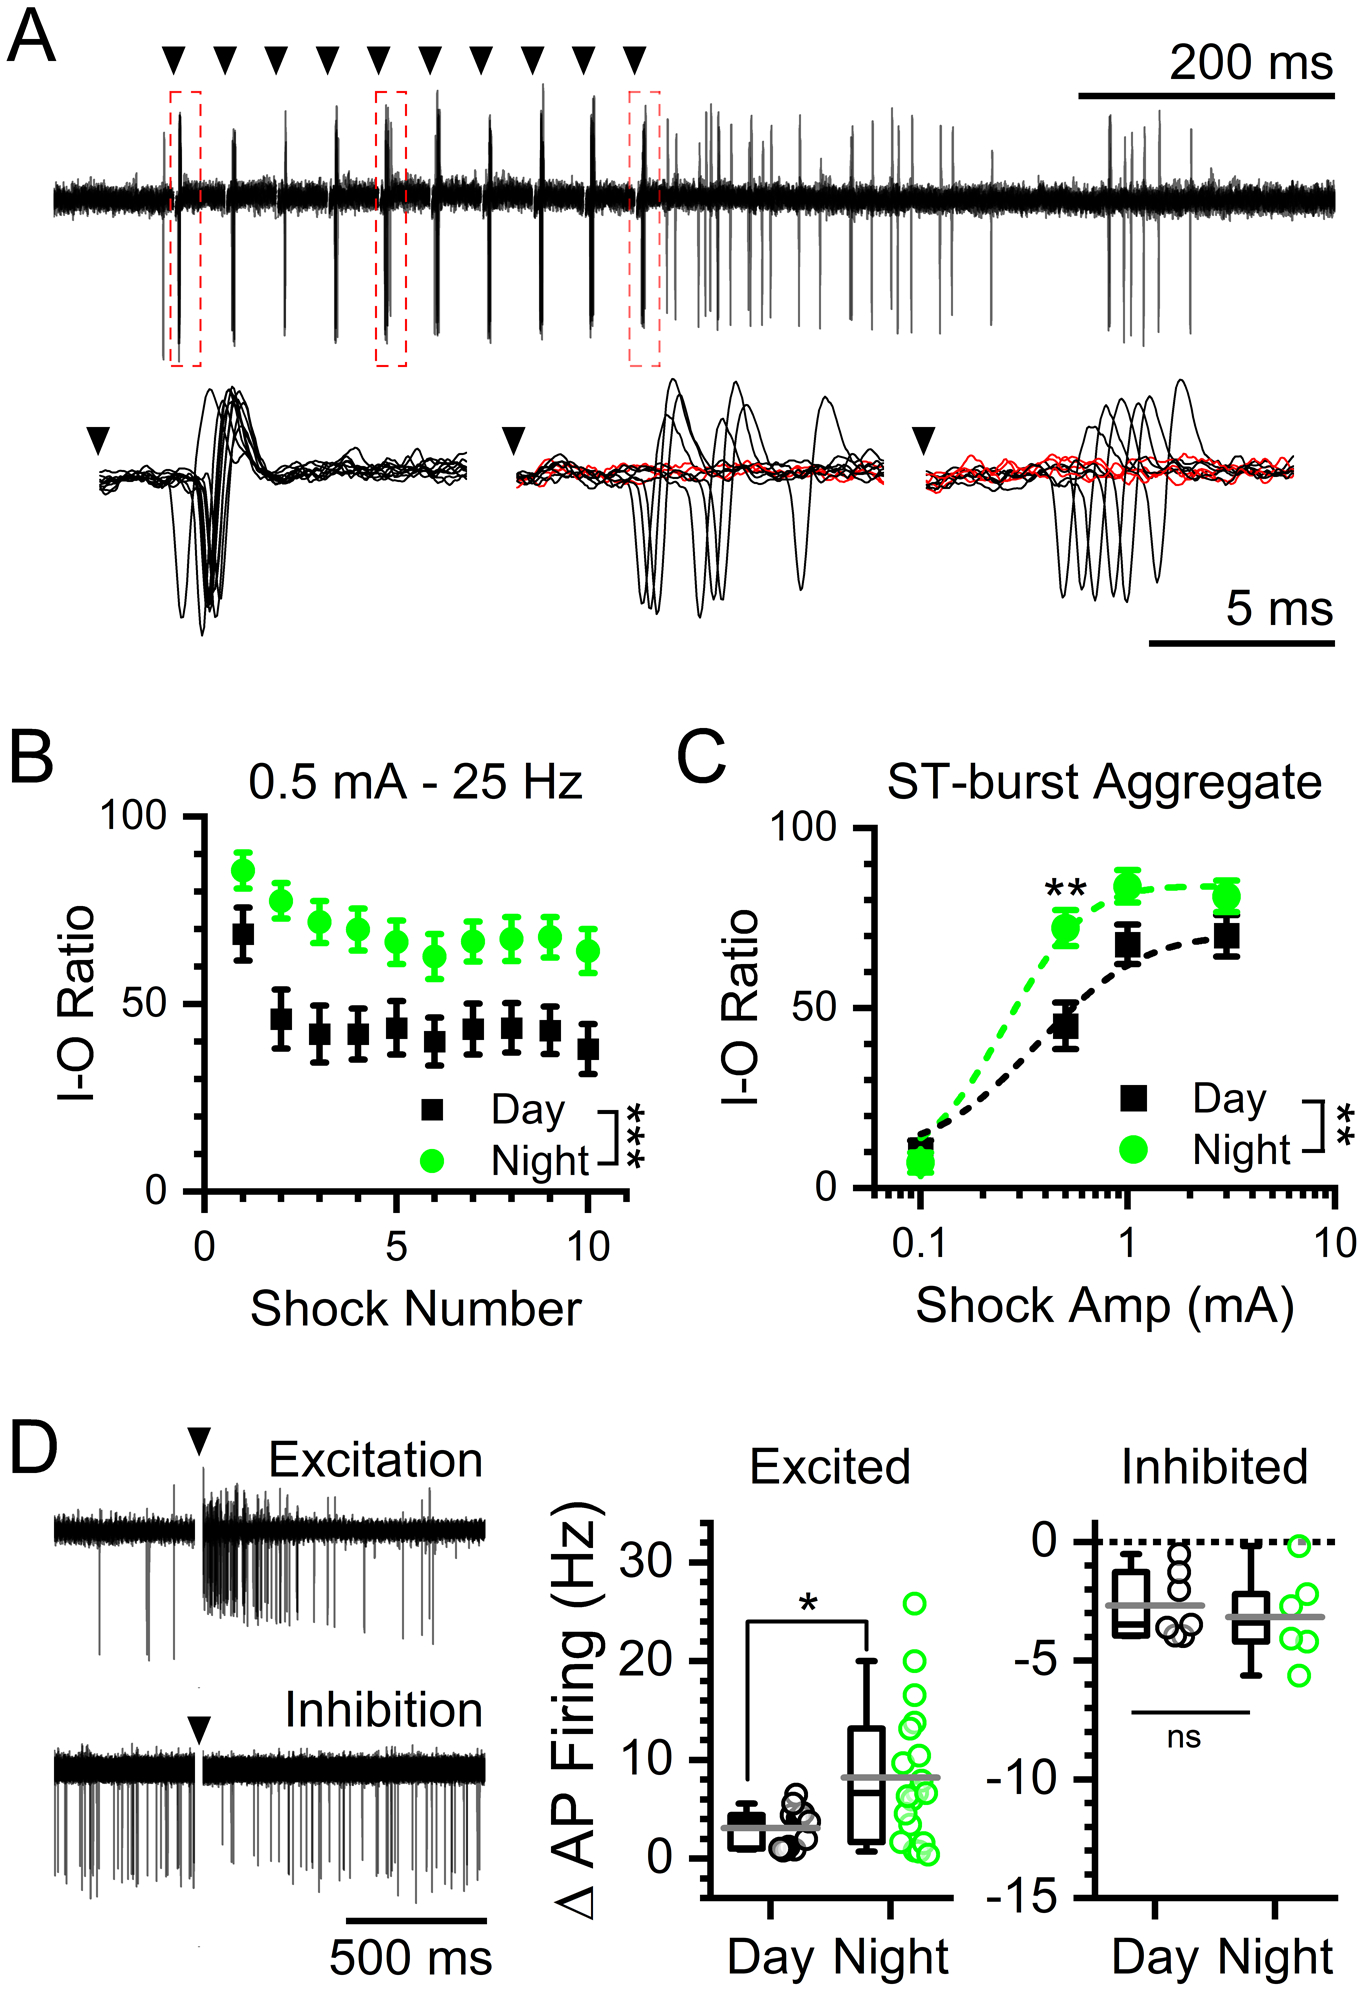
FIGURE 5: Paradoxical increase in afferent-evoked synaptic throughput at night.

A) Representative traces showing evoked action potentials by 0.5 mA stimulations at 25 Hz from cell-attached recordings of NTS neurons. Insets show individual action potentials evoked after shock 1 (left), shock 5 (middle), and shock 10 (right). Red traces denote failures. B) Plot of the throughput (% successes) of individual stimulations over a train of 10 ST shocks at 0.5 mA stimulation intensity during daytime (ZT5–9) and nighttime (ZT17–21) recordings. At 0.5 mA stim intensity there was a statistical interaction between stimulus number and timed of day with throughput was significantly higher during the night (2-way ANOVA, N = 30 – 39 neurons / 6 mice, ***P < 0.001). Data are plotted as the average ± sem. C) Recruitment curve of action potential throughput at increasing stimulation intensities. Data are plotted as the average ± sem. There was a significant interaction between time of day and stimulus intensity with throughput was higher at night (2-way ANOVA, N = 30 −39 neurons / 6 mice, **P = 0.008). Post hoc analysis showed a significant difference in throughput at an intermediate stimulus intensity (0.5 mA) (Bonferroni corrected T-Test, N = 30 – 39 neurons / 6 mice, **P = 0.006) but not at very high (1 mA: P = 0.25 and 3 mA: P = 0.72) or low intensities (0.1 mA: P = 0.71). D) Representative traces of excited (top) and inhibited (bottom) post-simulation responses. Neurons recorded during the night had a significantly larger post-stimulation excitatory responses compared to day (T-Test, N = 13 – 19 neurons / 6 mice, *P = 0.03). There was no significant difference in the less common inhibitory responses between day or night (T-Test, N = 6 – 7 neurons / 6 mice, P = 0.61).
