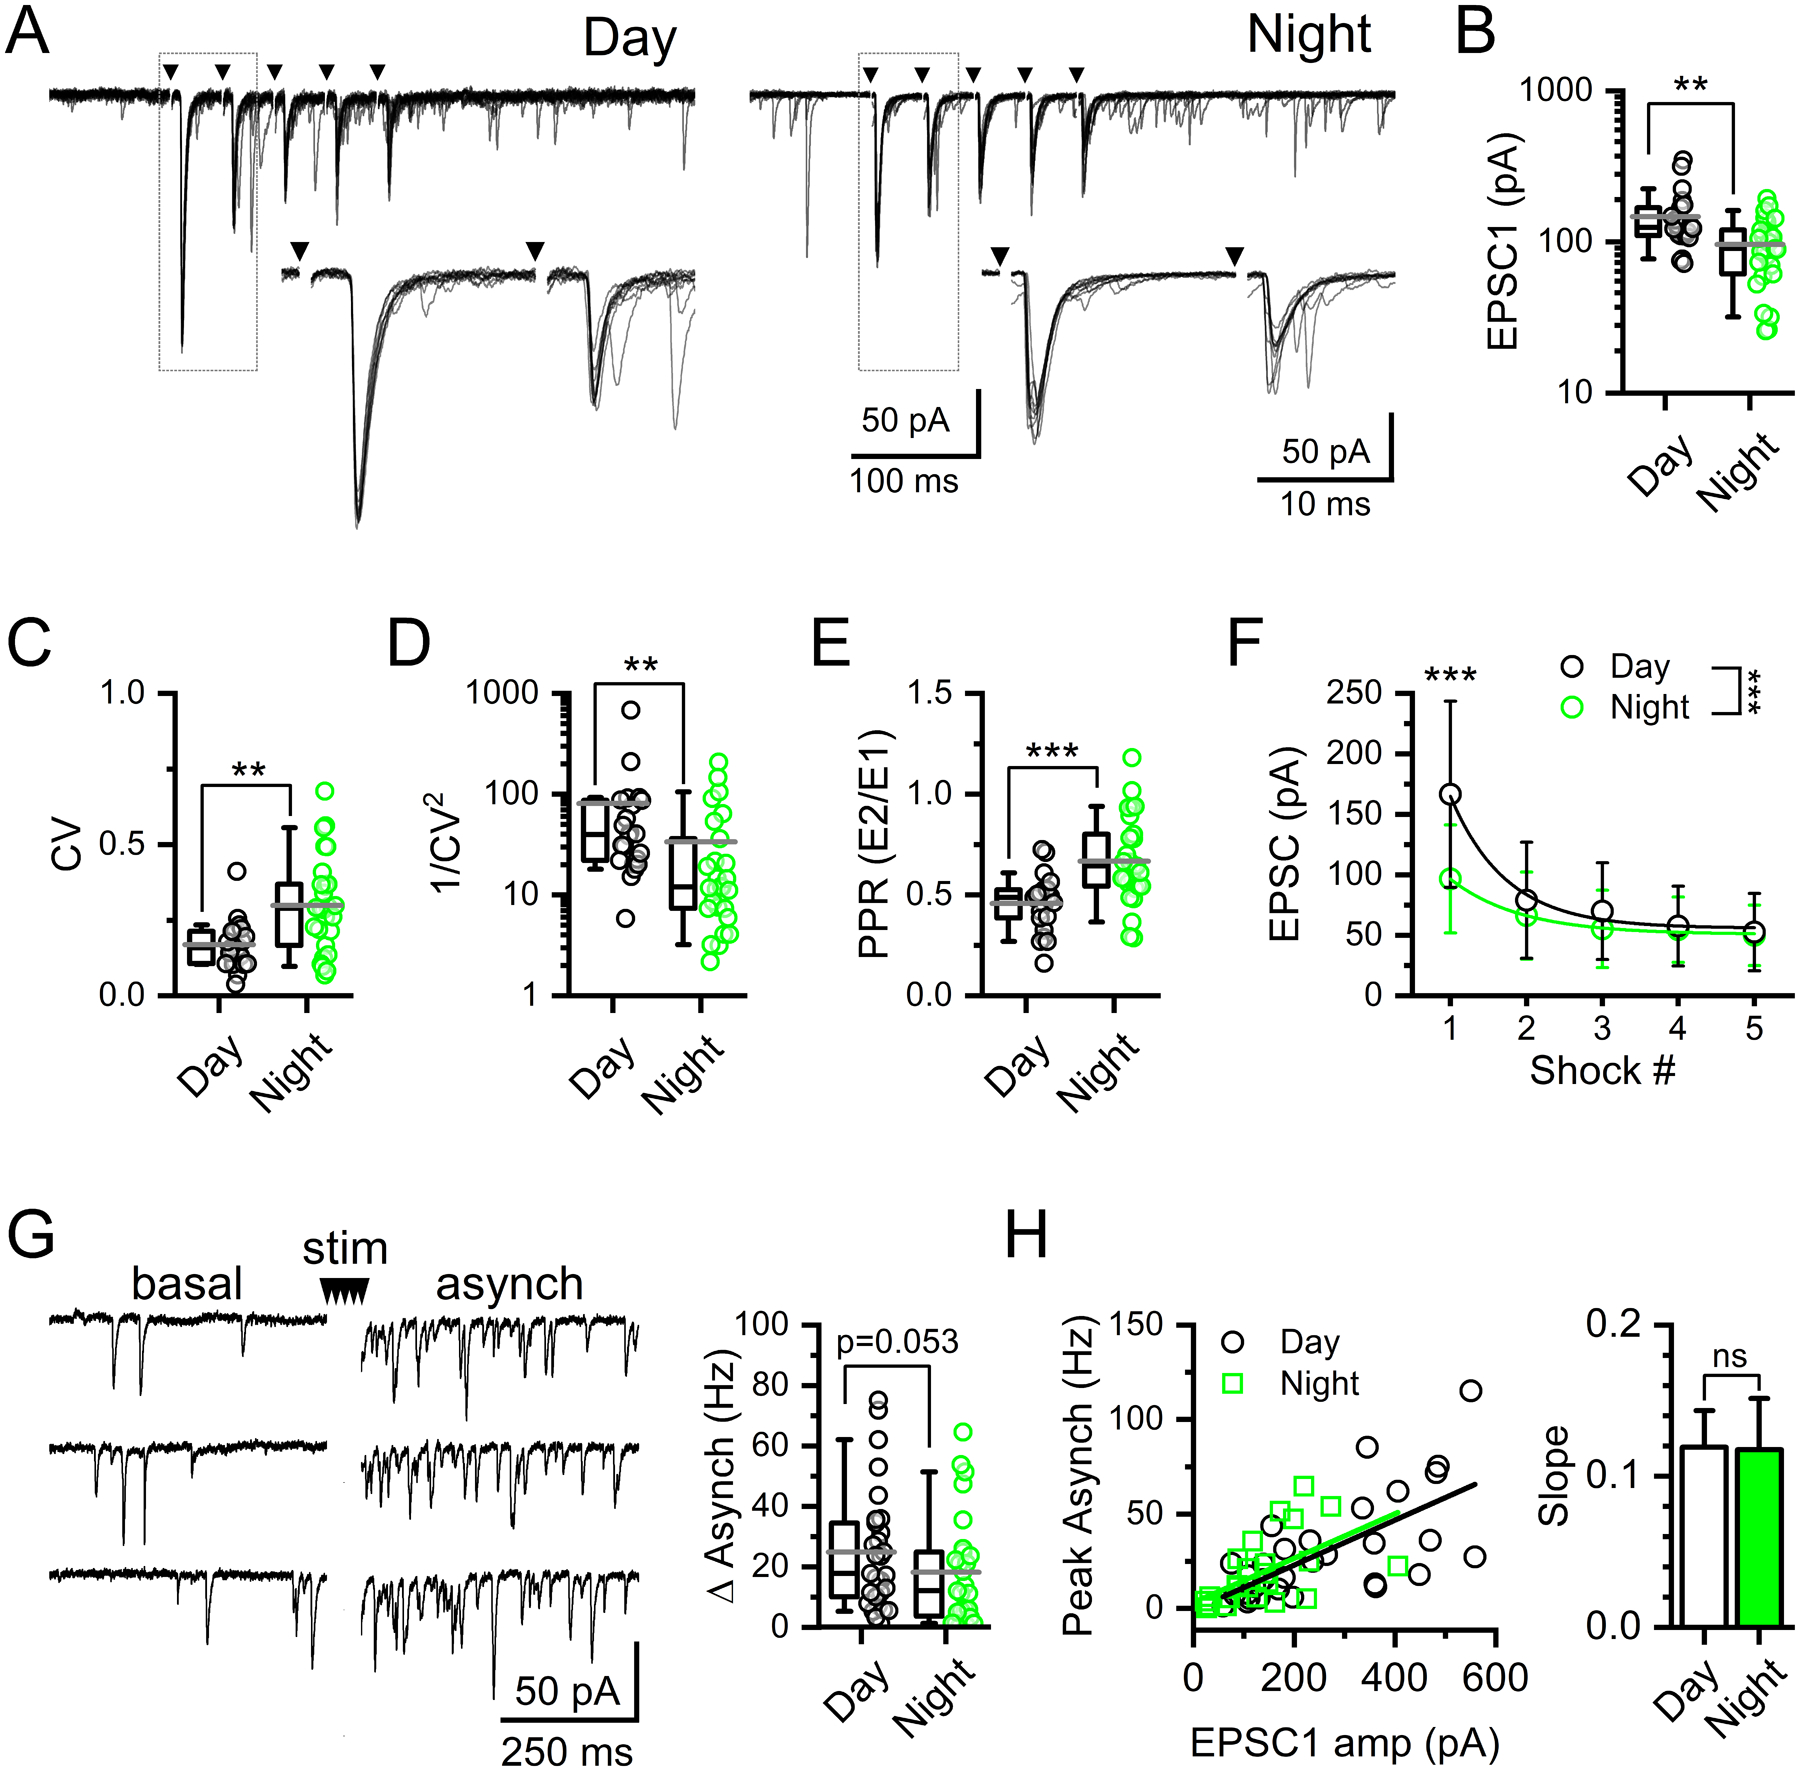
FIGURE 6: Day / night differences in evoked synchronous glutamate release consistent with presynaptic regulation of the probability of release.

A) Representative current traces showing 25 Hz suprathreshold stimulation of solitary-tract (ST) afferents and resulting synchronous EPSCs (ST-EPSCs) recorded from slices taken in the day compared to the slices taken at night. Arrows denote time of ST shocks with traces shown as an overlay of 10 individual trials. B) The average ST-EPSC amplitude was significantly smaller in recordings made at night compared to the day (T-Test, N = 23 – 27 neurons / 11 mice, **P = 0.002). C) The amplitude variability of EPSC1, Coefficient of variance (CV), was significantly higher in recordings made at night (Mann-Whitney Rank Sum Test, **P = 0.004). D) Due to this difference in CV, 1/CV2 was significantly higher during the day compared to the night (Mann-Whitney Rank Sum Test, **P = 0.004). E) As a result of changes in EPSC1, the paired-pulse ratio (PPR) was significantly higher at night compared to the day (T-Test, N = 23 – 27 neurons / 11 mice, ***P = 0.0004). F) Average ST-EPSC amplitude across five shocks show a significant difference between day and night (2-way RM ANOVA, N = 42 neurons / 11 mice, ***P < 0.001). Post hoc analysis confirmed EPSC1, but not EPSC2–5, was significantly smaller during the night compared to recordings made during the day (Bonferroni corrected T-Test, EPSC1: ***P < 0.001, EPSC2: P = 0.29, EPSC3: P = 0.21, EPSC4: P = 0.66, EPSC5: P = 0.83). G) Afferent-evoked asynchronous EPSCs, elicited by a series of five ST shocks, were not statistically different between day and night recordings (Mann-Whitney Rank Sum Test, N = 27 – 31 neurons / 11 mice, P = 0.053). H) Plot of asynchronous release as a function of EPSC1 amplitude. There was no significant difference in the slope of the EPSC1 to asynchronous frequency relationship between day and night (Mann-Whitney Rank Sum Test, N = 27 – 31 neurons / 11 mice, P = 0.67). Summary data boxplots show the mean (long gray bar) median (short black bar) with 25–75%, and 10–90% whisker length.
