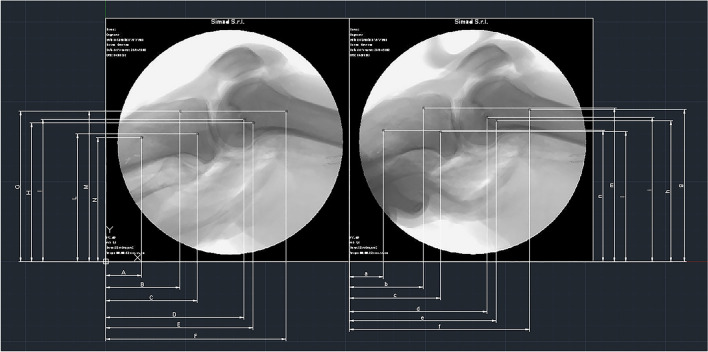
Fig. 5.
Example of the method used to obtain objective ATT data by stress radiographs, by tracking the differences between the initial position of the tibia (resting phase, RP) and its final position during testing (loading phase, LP). For each of the 6 titanium spheres identified within the radiograph, an X- and Y-coordinate was identified and the X- and Y-components of the cluster of 3 titanium spheres of the tibia and femur were averaged to obtain the exact difference (delta, Δ) of tibial and femoral position between the RP and LP

