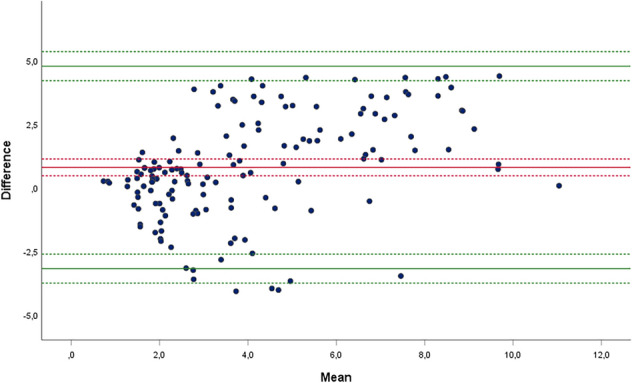
Fig. 6.

Bland–Altman scatter plot of differences against mean measures of anterior tibial translation (ATT) obtained with BLU-DAT and those obtained on stress radiographs. Difference was calculated as BLU-DAT measure—stress x-ray measure. Measures of ATT are expressed in millimeters. The middle (red) line represents the mean difference, and the top and bottom (green) lines represent the limits of agreement (LOA) between the two methods of measurements. Dotted lines represent 95% Cis around mean difference (red dotted line) and around upper and lower LOA (green dotted lines), respectively
