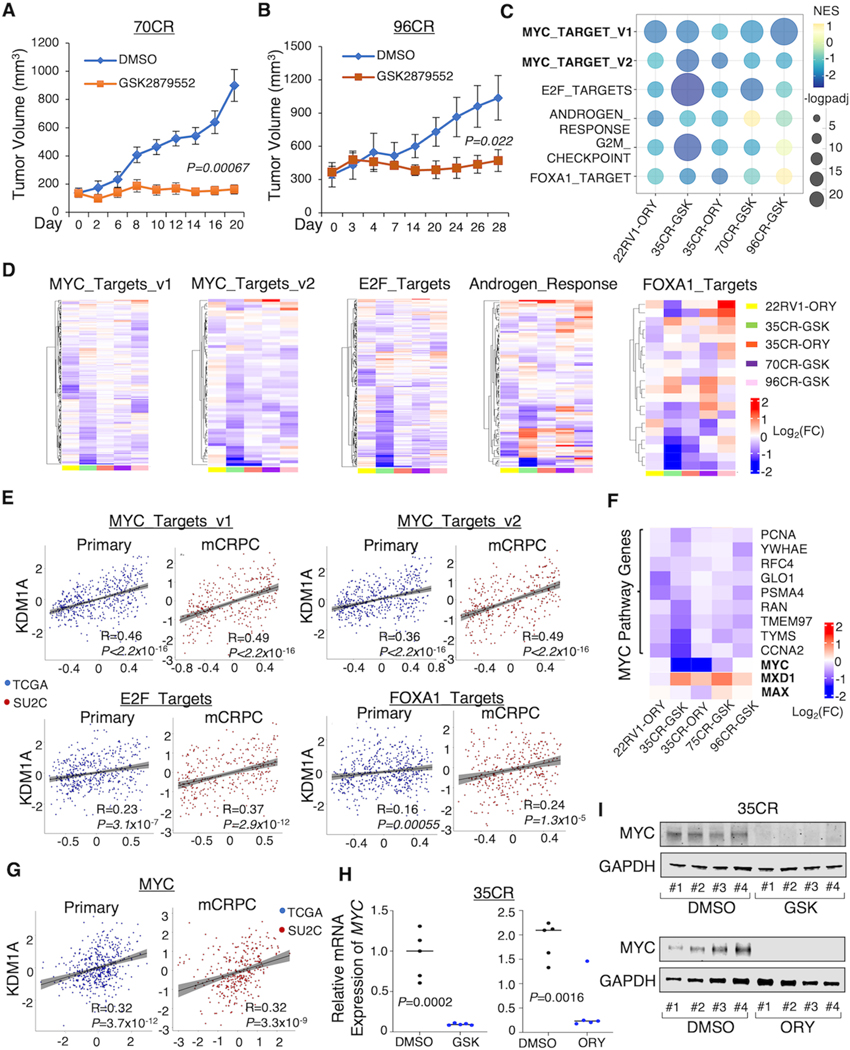
Figure 1. LSD1 inhibition represses MYC signaling in various CRPC models.
(A, B) Castrated SCID mice bearing LuCaP 70CR (A) and 96CR (B) PDX xenografts were treated daily with DMSO or LSD1 inhibitor GSK2879552 (33 mg/kg) via intraperitoneal injection, and the tumor volume was measured by caliper at indicated time points. (C, D) Tumor samples from each xenograft model were subjected to RNA-seq studies. Gene set enrichment analysis (GSEA) was done by comparing the LSD1 inhibitor treatment with vehicle treatment. The bubble plot (C) and heatmap views (D) show the top ranked LSD1-i-repressed pathways that are most common among all models. (E) Correlations between KDM1A level and LSD1-i repressed pathways in TCGA and SU2C patient cohorts. (F) The heatmap view of MYC, MYC cofactors, and MYC targets. (G) The correlation between KDM1A level and MYC in TCGA and SU2C patient cohorts. (H, I) MYC expression levels in the 35CR model treated by LSD1-i were measured by RT-qPCR (H) and western blot (I).

