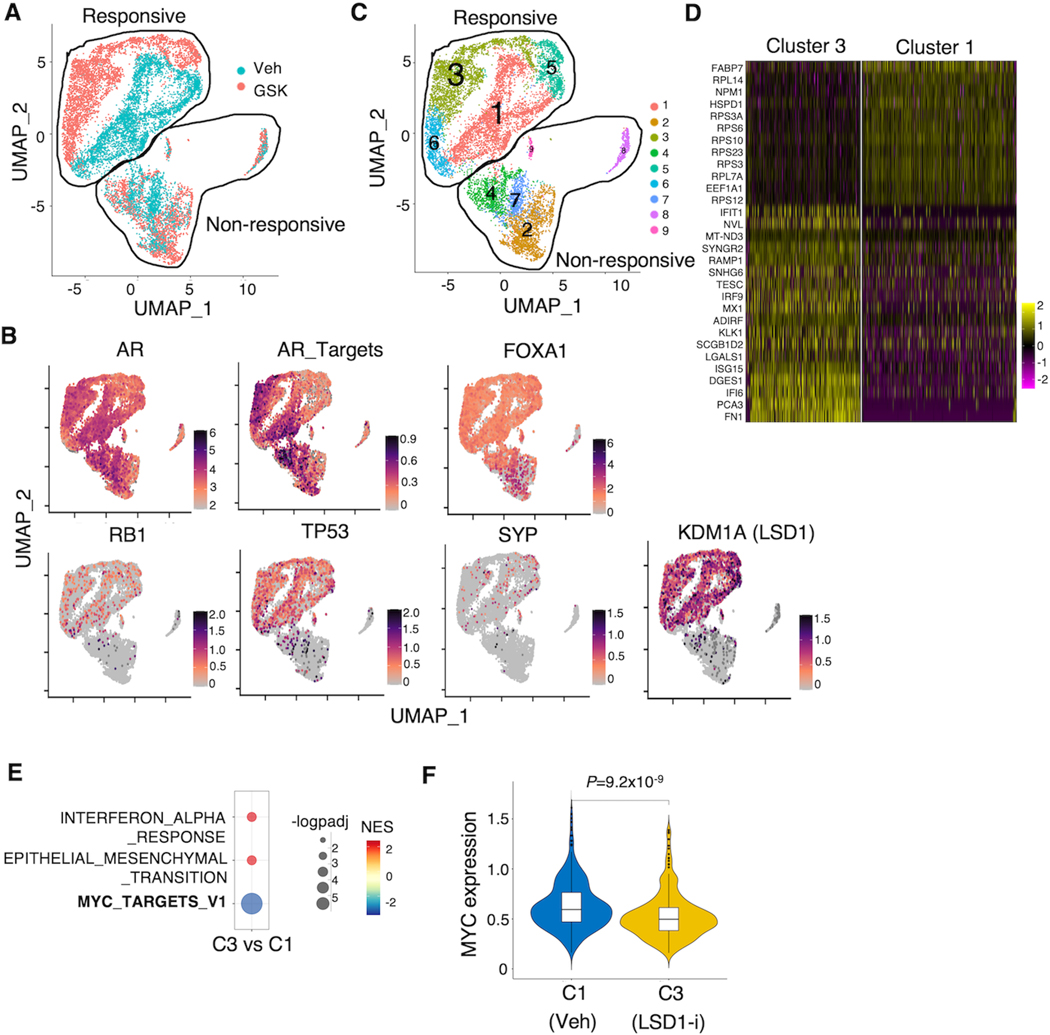
Figure 2. Heterogenous response to LSD1 inhibition in LuCaP 96CR model.
(A) Single-cell RNA-seq analysis demonstrated by the Uniform Manifold Approximation and Projection (UMAP) plot was generated (blue: vehicle, red: LSD1-i). (B) Expression levels of indicated genes were plotted onto the UMAP. (C) Cluster 1 (Vehicle treated) and cluster 3 (GSK treated) are highlighted. (D) Top-ranked genes that are differentially expressed between cluster 3 and cluster 1. (E) The GSEA showing the hallmark pathways that were significantly changed by GSK treatment (cutoff: P-adj<0.05). (F) The violin plot of MYC gene expression in Vehicle (cluster 1) vs. GSK2879552 (cluster 3).

