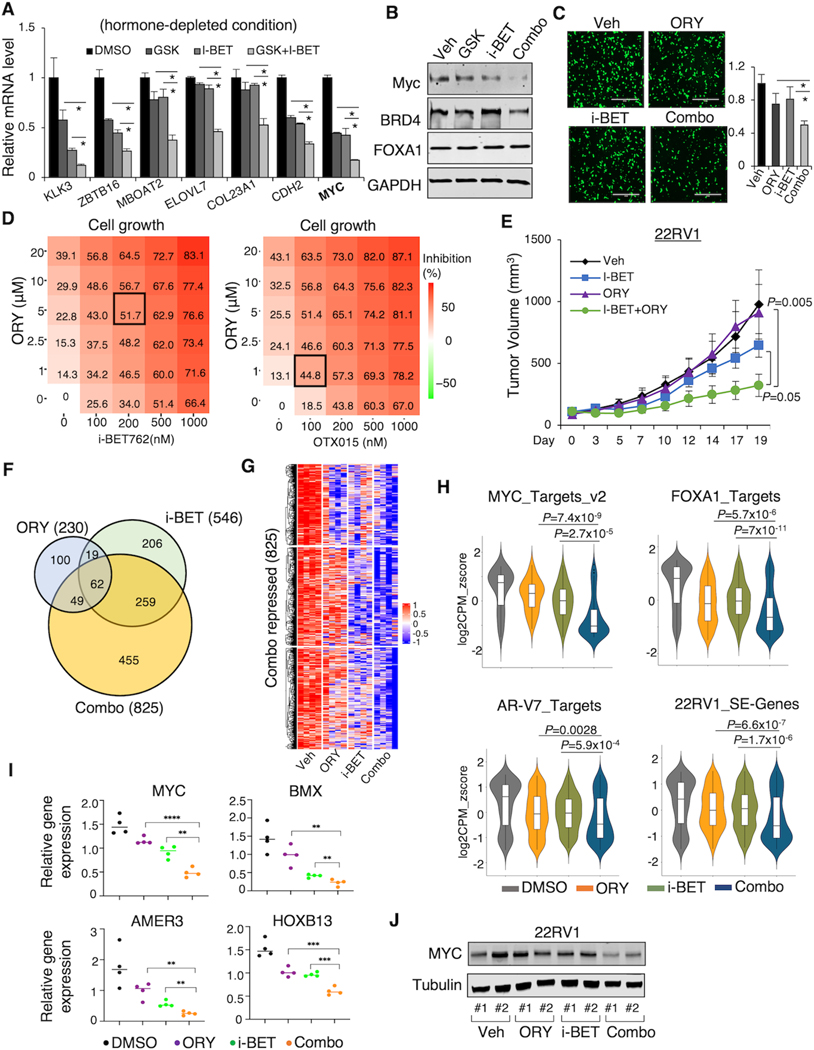
Figure 5. LSD1-i and BET-i synergistically suppress CRPC tumor growth.
(A, B, C) 22RV1 cells (in CSS) were treated with 1μM GSK2879552, 1μM i-BET762, or the combination for 1 day, and subjected to RT-qPCR analysis. Relative gene expression of AR/AR-V7 targets (A), protein expression of Myc, BRD4, and FOXA1 (B), and representative image and quantitative results of transwell migration assay (C) are shown. (D) The heatmap view of the percentage of inhibition of 22RV1 cells (in CSS) treated with the combination of indicated doses of ORY-1001 and BET inhibitors for 4 days. The dosages that achieve the highest synergy are highlighted. (E) Castrated SCID mice bearing 22RV1 xenografts were treated with vehicle, i-BET762 (16mg/kg, daily), ORY-1001 (0.03mg/kg, every other day), or the combination via intraperitoneal injection (for ORY-1001) or oral gavage (for i-BET762). Tumor volume was measured by caliper. (F) RNA-seq analyses were performed using the tumor samples collected at the end of the experiment. The Venn diagram for ORY-1001-repressed genes, i-BET762-repressed genes, and the combination treatment-repressed genes is shown. (G) The heatmap view for the combination treatment-repressed genes in all tumor samples. (H) The violin plots showing the indicated gene signatures in the 22RV1 xenograft tumor samples. (I) RT-qPCR analysis of indicated gene expression in the tumor samples. (J) Immunoblotting for c-Myc expression in the tumor samples. Data in bar graphs represent the mean ± SD. Data in growth curves represent the mean ± SD.

