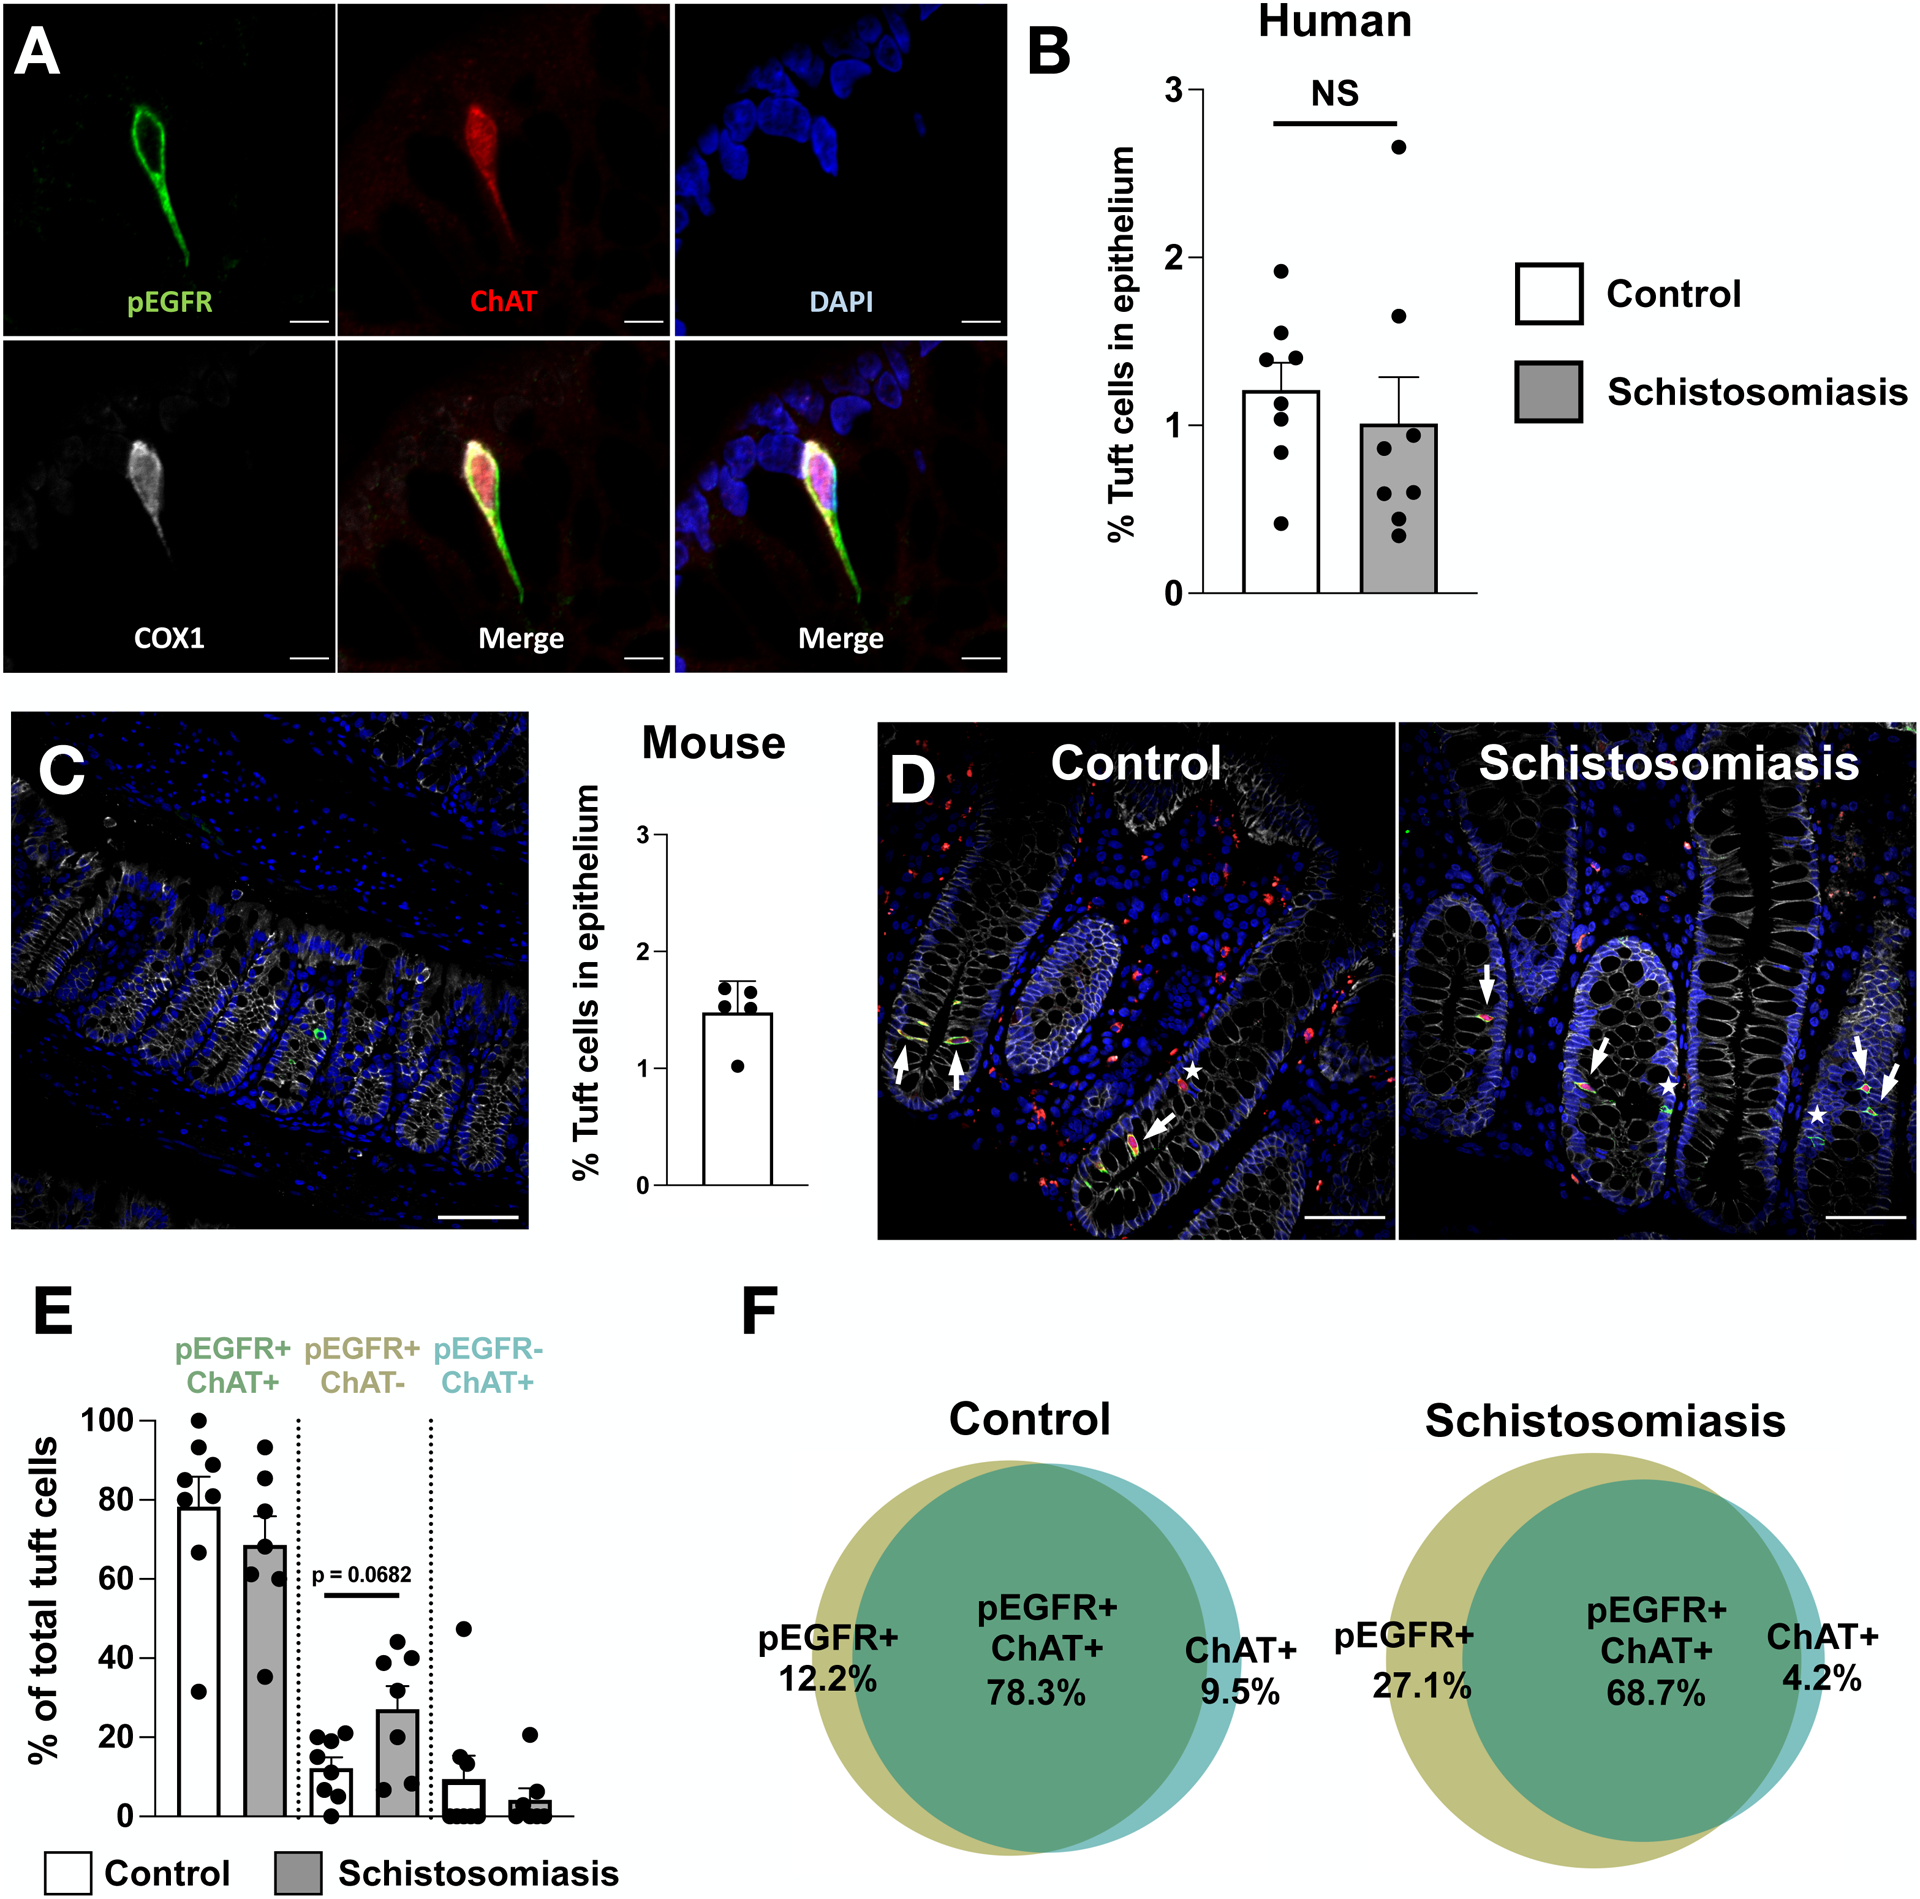
Fig. 3. Colonic tuft cell hyperplasia is absent in patients with chronic intestinal schistosomiasis.

(A) Representative image of a colonic tuft cell in an uninfected patient. pEGFR is shown in green, ChAT in red, DAPI in blue, and COX1 in white (scale bar, 5 μm). (B) Abundance of pEGFR/ChAT double-positive colonic tuft cells in uninfected and schistosome-infected patients. Points represent individual patients. (C) Representative image of tuft cells in the colon of specific-pathogen free (SPF) mice without parasites. Tuft cells are stained with DCLK1 in green, E-Cadherin in red, and DAPI in blue (scale bar, 50 μm). Tuft cell abundance in colonic epithelium of SPF mice determined by quantitative microscopy. Points represent individual mice. (D) Representative images of colonic tuft cells in uninfected and schistosome-infected patients. pEGFR is shown in green, ChAT in red, DAPI in blue, and E-Cadherin in white. White arrows depict pEGFR/ChAT double-positive tuft cells. White stars depict pEGFR or ChAT single-positive tuft cells (scale bar, 50 μm). (E-F) Proportion of pEGFR/ChAT double-positive, pEGFR single-positive, and ChAT single-positive colonic tuft cells in uninfected and schistosome-infected patients. Data are plotted as means with SEM in (E) or as venn-diagrams in (F). Points represent individual patients. NS, not significant; using Mann-Whitney tests.
