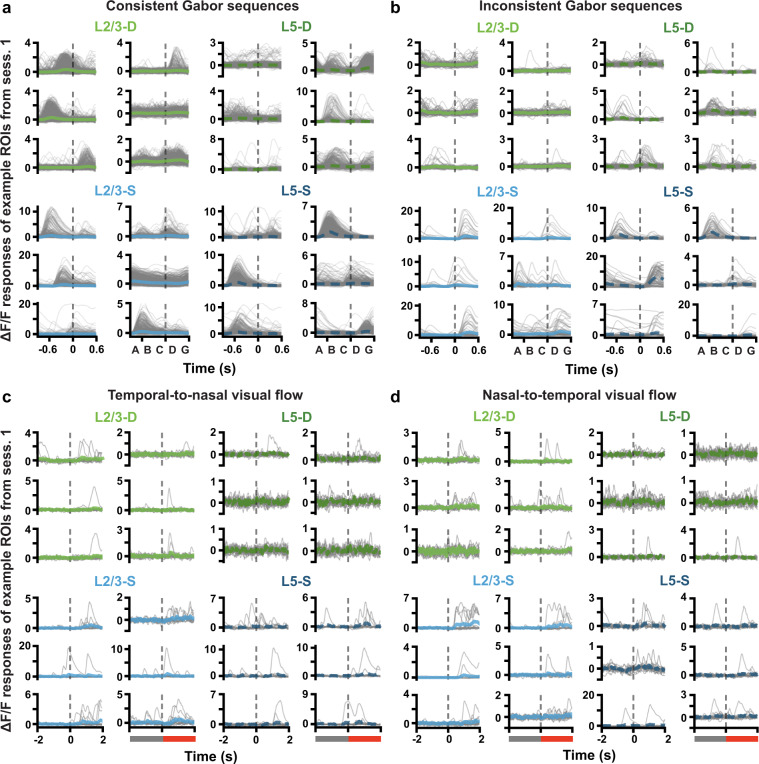
Fig. 5.
(a) ΔF/F response traces to each consistent Gabor sequence (gray) for example ROIs. Mean (±SEM) ΔF/F responses across sequences are plotted in blue or green. Dashed vertical lines mark onset of D images. Plotted ROIs were randomly selected from session 1 ROIs deemed consistently responsive to Gabor sequences, based on the following criteria: (1) their SNR was above the median for the session, (2) the median pairwise correlation between their individual sequence responses, as well as the standard deviation and skew of their mean response, were each above the 75th percentile for the session. Responses to individual sequences were smoothed using a four-point moving average, for correlation calculation and plotting, only. (b) Same as a., but for inconsistent sequences. (c) ΔF/F response traces to the onset of inconsistent flow, during temporal-to-nasal visual flow. Dashed vertical lines mark onset of inconsistent flow at time 0. Plotted ROIs were randomly selected from session 1 ROIs deemed responsive to the onset of inconsistent visual flow, based on the following criteria: (1) their SNR was above the median for the session, (2) the median pairwise correlation between their individual sequence responses to inconsistent flow, as well as the difference in mean response to inconsistent vs consistent flow, were each above the 75th percentile for the session. (d) Same as c., but for nasal-to-temporal visual flow.

