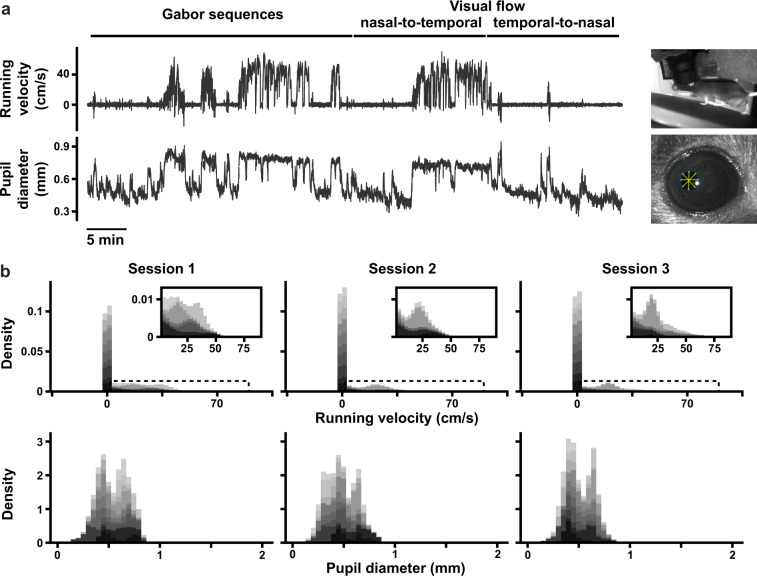
Fig. 6.
(a) (Top) Example running velocity trace (in cm/s) and (bottom) pupil diameter trace (in mm) for an example optical physiology session, lasting 70 min. Stimulus blocks are shown at the top, and the scale bar shows 5 min. (b) Histograms of aggregated running velocities (top) and pupil diameters (bottom), for each session. Data is stacked across all mice (11), with each mouse represented by a different shade of gray. Insets for the running velocity histograms (top) show close-ups of the areas marked by the dotted rectangles.

