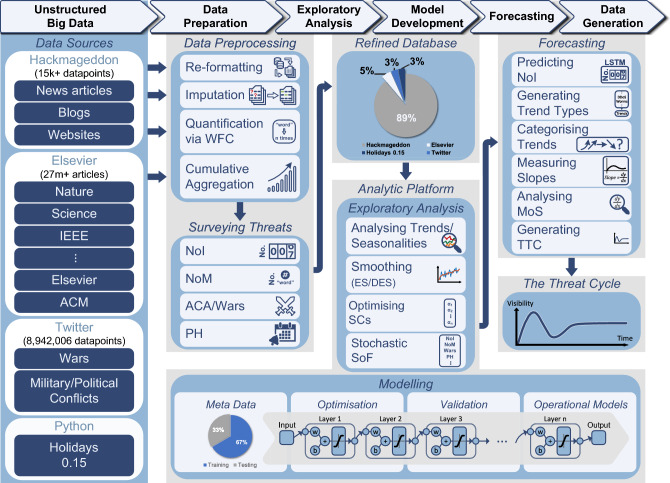
Figure 1.
The workflow and architecture of forecasting cyber threats. The ground truth of Number of Incidents (NoI) was extracted from Hackmageddon which has over 15,000 daily records of cyber incidents worldwide over the past 11 years. Additional features were obtained including the Number of Mentions (NoM) of each attack in the scientific literature using Elsevier API which gives access to over 27 million documents. The number of tweets about Armed Conflict Areas/Wars (ACA) was also obtained using Twitter API for each country, with a total of approximately 9 million tweets. Finally, the number of Public Holidays (PH) in each country was obtained using the holidays library in Python. The data preparation phase includes data re-formatting, imputation and quantification using Word Frequency Counter (WFC) to obtain the monthly occurrence of attacks per country and Cumulative Aggregation (CA) to obtain the sum for all countries. The monthly NoM, ACA and PHs were quantified and aggregated using CA. The numerical features were then combined and stored in the refined database. The percentages in the refined database are based on the contribution of each data source. In the exploratory analysis phase, the analytic platform analyses the trend and performs data smoothing using Exponential Smoothing (ES), Double Exponential Smoothing (DES) and No Smoothing (NS). The smoothing methods and Smoothing Constants (SCs) were chosen for each attack followed by the Stochastic Selection of Features (SoF). In the model development phase, the meta data was partitioned into approximately 67% for training and 33% for testing. The models were learned using the encoder-decoder architecture of the Bayesian Long Short-Term Memory (B-LSTM). The optimisation component finds the set of hyper-parameters that minimises the error (i.e., M-SMAPE), which is then used for learning the operational models. In the forecasting phase, we used the operational models to predict the next three years’ NoIs. Analysing the predicted data, trend types were identified and attacks were categorised into four different trends. The slope of each attack was then measured and the Magnitude of Slope (MoS) was analysed. The final output is The Threat Cycle (TTC) illustrating the attacks trend, status, and direction in the next 3 years.

