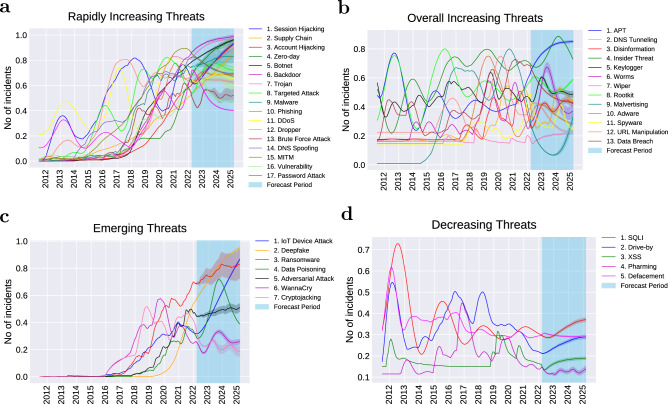
Figure 4.
A bird’s eye view of threat trend categories. The period of the trend plots is between July, 2011 and March, 2025, with the period between April, 2022 and March, 2025 forecasted using B-LSTM. (a) Among rapidly increasing threats, as observed in the forecast period, some threats are predicted to continue a sharp increase until 2025 while others will probably level off. (b) Threats under this category have overall been increasing while fluctuating over the past 11 years. Recently, some of the overall increasing threats slightly declined however many of those are likely to recover and level off by 2025. (c) Emerging threats that began to appear and grow sharply after the year 2016, and are expected to continue growing at this increasing rate, while others are likely to slow down or stabilise by 2025. (d) Decreasing threats that peaked in the earlier years and have slowly been declining since then. This decreasing group are likely to level off however probably will not disappear in the coming 3 years. The Y axis is normalised to account for the different ranges of values across different attacks. The 95% confidence interval is shown for each threat prediction.

