
Figure 4.
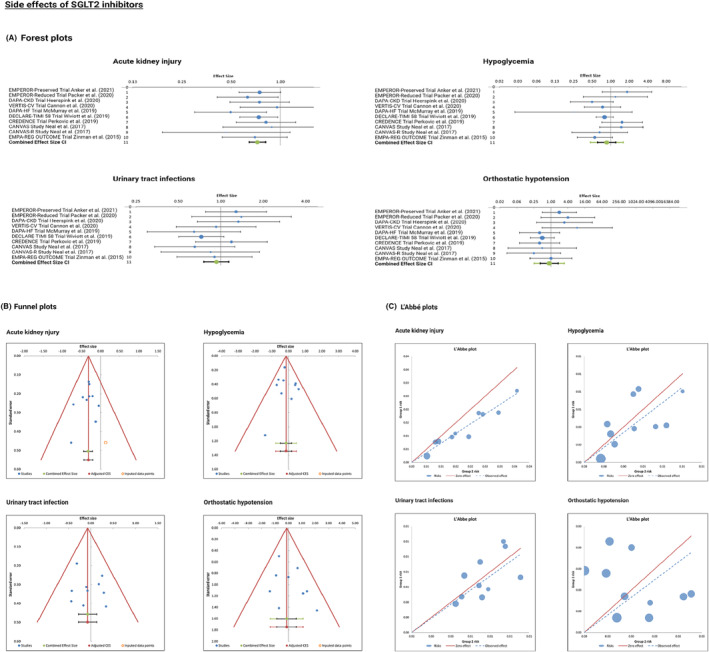
(A) Forest plot of placebo‐controlled randomized trials examining the pooled effects of SGLT2 inhibitors‐related common side effects. The meta‐analytic results (lines 11) consist of two intervals, both around the same bullet, which represent the weighted average effect or the combined effect size. Confidence interval is represented by the smaller, black interval, whereas prediction interval is represented by the larger green interval. (B) Funnel plot of placebo‐controlled randomized trials examining the side effects of SGLT2 inhibitors, depicting effect sizes against their standard errors. (C) L'Abbé plot showing the side effects in the intervention group (SGLT2 inhibitors) against the side effects in the placebo group.