
Figure 6.
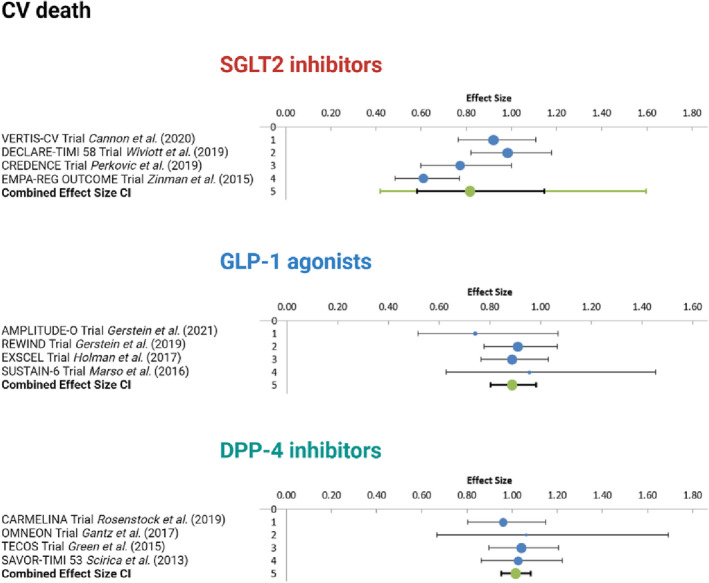
Forest plot of placebo‐controlled randomized trials comparing the pooled effects of SGLT2 inhibitors, GLP‐1 agonists, and DPP‐4 inhibitors on cardiovascular death. The meta‐analytic results (lines 5) consist of two intervals, both around the same bullet, which represent the weighted average effect or the combined effect size. Confidence interval is represented by the smaller, black interval, whereas prediction interval is represented by the larger green interval.