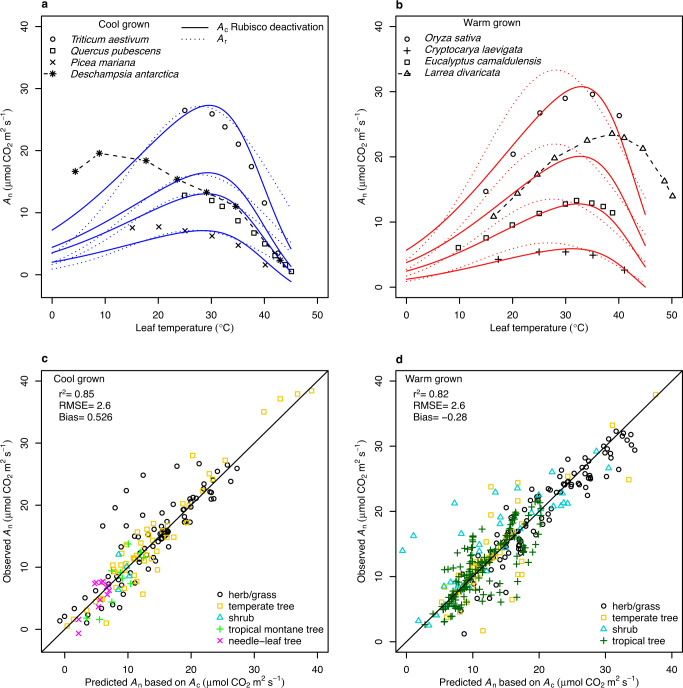
Fig. 2. Observations, modelled simulations, and the predictability of the leaf temperature response of net CO2 assimilation (An) for individual species and plant functional types.
a The An temperature response of four representative cool grown species: Triticum aestivum (herb/grass), Quercus pubescens (temperate tree), Picea mariana (needle-leaf tree), and Deschampsia antarctica (herb/grass). For D. antarctica, an extremophile that was grown at 12 °C, the broken line between observations highlights the deviation from the model prediction below 30 °C for this species. Points are observations and the curves are the Rubisco carboxylation limited assimilation rates (Ac) with Rubisco deactivation included parameterised to cool grown plants (solid blue lines), or RuBP regeneration limited CO2 assimilation rates (Ar) parameterised to cool grown plants (dotted blue lines). b Four representative warm grown species: Oryza sativa (grass), Cryptocarya laevigata (tropical tree), Eucalyptus camaldulensis (temperate tree), and Larrea divaricata (shrub). For L. divaricata, an extremophile that was grown at 44 °C, the broken line between observations highlights the deviation from the model prediction above 30 °C for this species. Points are observations and the curves are the Ac with Rubisco deactivation included for warm grown plants (solid red lines), or Ar for warm grown plants (dotted red lines). c, d Predictions of Ac which included Rubisco deactivation were plotted against corresponding observations for cool (c) and warm (d) grown plants. The coefficient of determination (r2), a 1:1 ratio (solid line), the root mean squared error (RMSE) between observed and predicted values (μmol m−2 s−1), and the bias in observations being greater than predictions (μmol m−2 s–1) for each growth environment are provided. Plant functional types are indicated by differing symbols and colours.

