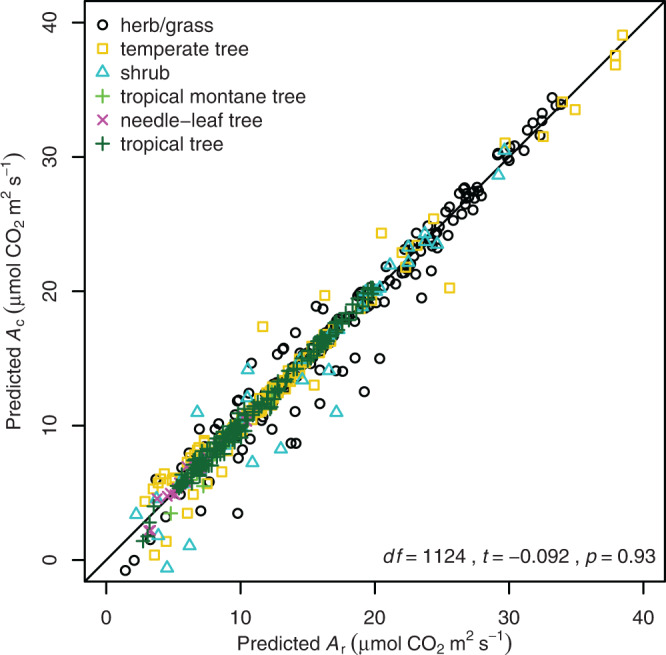
Fig. 3. Comparison of net photosynthetic CO2 assimilation predictions based on Rubisco carboxylation that included Rubisco deactivation (Ac) and rates of RuBP regeneration (Ar).

Values correspond to temperature and species observation predictions for the temperature response curves of 49 species previously published (Supplementary Table 4). Plant functional types are indicated by different symbols and colours. The degrees of freedom (df), t value (t), and p value (p) of a Welch Two Sample t test comparing Ac and Ar are presented in the graph. The solid line is the 1:1 ratio.
