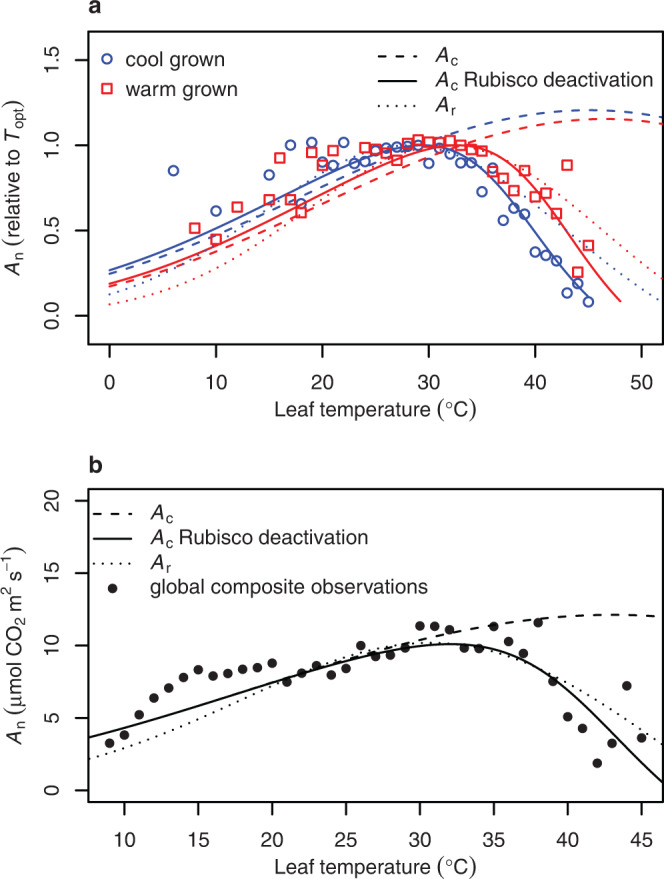
Fig. 4. The implications of Rubisco deactivation on net CO2 assimilation predictions.

a Net CO2 assimilation rates (An) from temperature response curves representing 49 C3 plant species (Supplementary Table 4). Individual temperature response curves were relativised to the maximum rate achieved at the temperature optimum (Topt), and points represent the means of relativised values that were binned by degree Celsius. Observed points were plotted against Rubisco carboxylation limited assimilation (Ac) with Rubisco totally active (dashed lines), accounting for Rubisco deactivation (solid lines), or assuming RuBP regeneration limited photosynthesis (Ar) based on chloroplast electron transport (J) and its response to temperature (dotted lines). Rubisco kinetics were categorised as cool (blue) or warm (red) grown species dependent on their day growth temperature being below or above 25 °C, respectively. b A composite temperature response curve (closed circles) based on a global dataset comprising of 311 species and 13,876 observations34. Mean An values, independent of species and experiment, were binned by degree Celsius. Observed points were plotted against Rubisco carboxylation limited assimilation (Ac) with Rubisco totally active (dashed lines), accounting for Rubisco deactivation (solid lines), or assuming RuBP regeneration limited photosynthesis (Ar) based on chloroplast electron transport (J) and its response to temperature (dotted lines).
