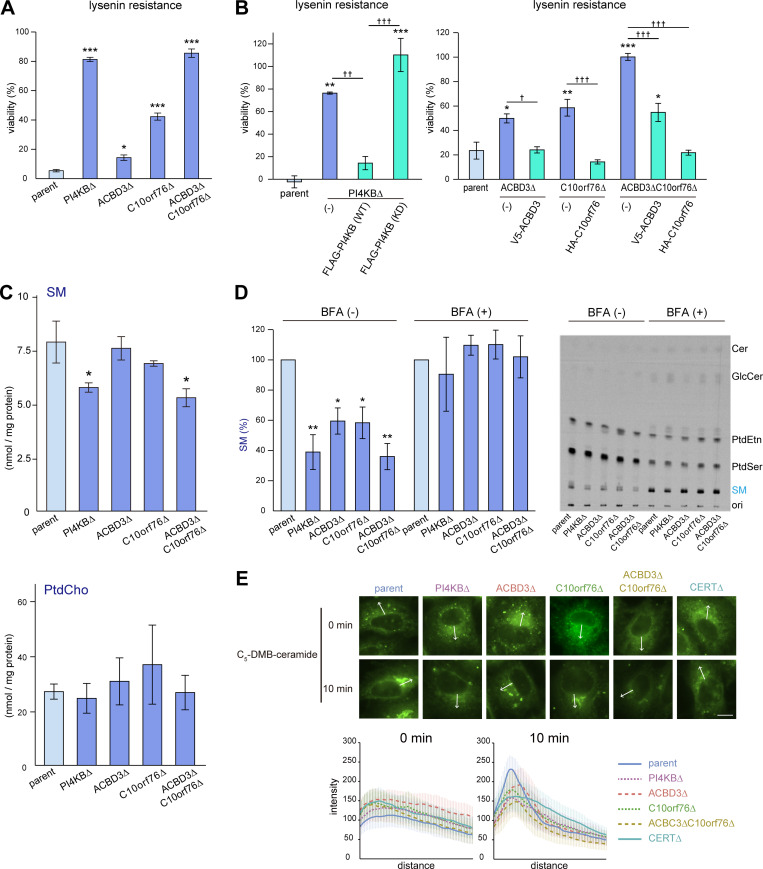
Figure 2.
Disruption of PI4KB, ACBD3, or C10orf76 downregulates SM synthesis. (A) Gene disruption of PI4KB, ACBD3, and C10orf76 confers lysenin resistance to HeLa cells. (B) Stable expression of N-terminally tagged recombinant proteins reverses the lysenin resistance in each of the KO cell lines. (A and B) Overnight cultured cells were treated with lysenin at 50 (A) or 100 (B) ng/ml for 2 h. Viability was estimated via a colorimetric assay using water-soluble formazan dye and is shown as the percentage of the A450 nm value in the absence of lysenin. The bar graph represents the mean ± SEM of three biological replicates. Representative data from at least two independent experiments with similar results are shown. (C) The content of cellular SM is decreased in PI4KB KO and ACBD3/C10orf76 DKO cells. Lipids were extracted from cells subcultured in serum-free medium then analyzed by LC–MS. The bar graph represents the mean ± SEM of three independent experiments. See also Fig. S2. (See Tables S2 and S3 for the raw data sets.) (D) De novo SM synthesis was defective in the KO cell lines. Overnight cultured cells pretreated with mock or 1 μg/ml BFA for 30 min were metabolically labeled with L-[14C(U)]-serine for 8 h. Lipids were extracted from cell lysates (with the equal protein amounts among the samples) and separated using TLC. The intensity of autoradiography of labeled SM was analyzed using ImageJ, with the intensity of parent cells set to 100%. The bar graph represents the mean ± SEM of three independent experiments. A representative autoradiography image of the TLC plates is shown. (A–D) * and † represent statistically significant differences between the KO cells and the parent cells, or between samples linked with black lines, respectively. * and †, P < 0.05; ** and ††, P < 0.005; *** and †††, P < 0.0005. Statistical analysis of A, C, and D were performed by one-sided Dunnett test. Tukey-Kramer test was used for B. (E) Analysis of intracellular trafficking of C5-DMB-ceramide. Cells were labeled with C5-DMB-ceramide complexed with BSA for 30 min at 4°C and chased for 10 min at 37°C. Fixed cells were subjected to fluorescence microscopy observation. Graphs represent the mean ± SD of line profiles of the perinucleus regions of interest (ROIs, depicted by white arrows), calculated from n > 25 cells in at least three images. Data are representative of at least two independent experiments with similar results. Scale bar, 10 μm.

