Figure 4.
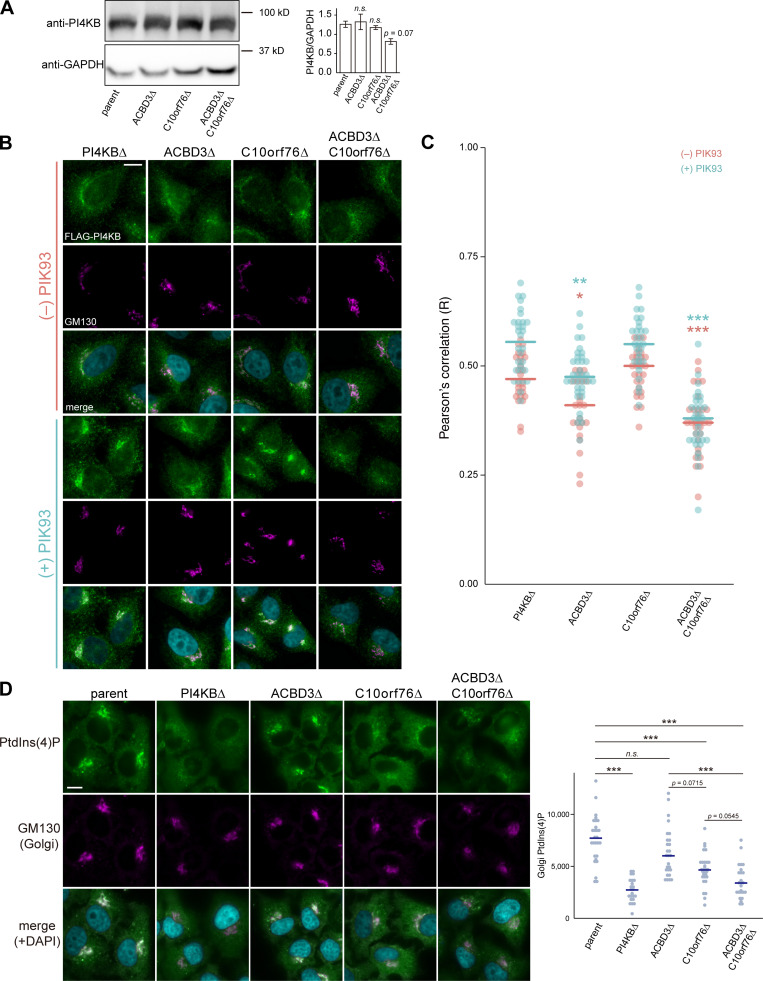
PI4KB requires either ACBD3 or C10orf76 for its recruitment to the Golgi apparatus. (A) Western blot analysis of the abundance of endogenous PI4KB. Cell lysates were immunoblotted with anti-PI4KB or anti-GAPDH antibodies. The graph represents the mean ± SEM (three biological replicates) of the band intensity of PI4KB, which was normalized by that of the loading control GAPDH. Statistical significance was determined by two-sided Dunnett test. n.s., not significant. (B) Microscopic observation of FLAG-PI4KB recruitment to the Golgi apparatus. Cells stably expressing FLAG-PI4KB were treated with 0 or 2 μM PIK93 for 4 h. Fixed cells were then immunostained with anti-FLAG and anti-GM130 antibodies. (C) Image analysis of B. Data are representative of two independent experiments with similar results. The dots represent the Pearson’s correlation coefficient between FLAG-PI4KB and the Golgi marker GM130 in one cell (n = 24–36), calculated from at least three images. The line segments represent the median. Orange, without PIK93; light blue, PIK93-treated. Statistical differences, determined by Steel-Dwass test, between the parent and KO cells in each of the PIK93-treated and untreated conditions are shown. *, P < 0.05; **, P < 0.005; ***, P < 0.0005. (D) Analysis of PtdIns(4)P pools in the Golgi apparatus. Fixed cells were immunostained with anti-PtdIns(4)P and anti-GM130 antibodies. The dots represent the intensity of Golgi-PtdIns(4)P normalized by the Golgi area in one cell (n = 23–30), calculated from at least three images. Data are representative of two independent experiments with similar results. The blue line segments represent the median. Statistical significance was determined by Steel-Dwass test. ***, P < 0.0005. n.s., not significant. (B and C) Nuclei were visualized by staining with DAPI. Scale bars, 10 μm. Source data are available for this figure: SourceData F4.

