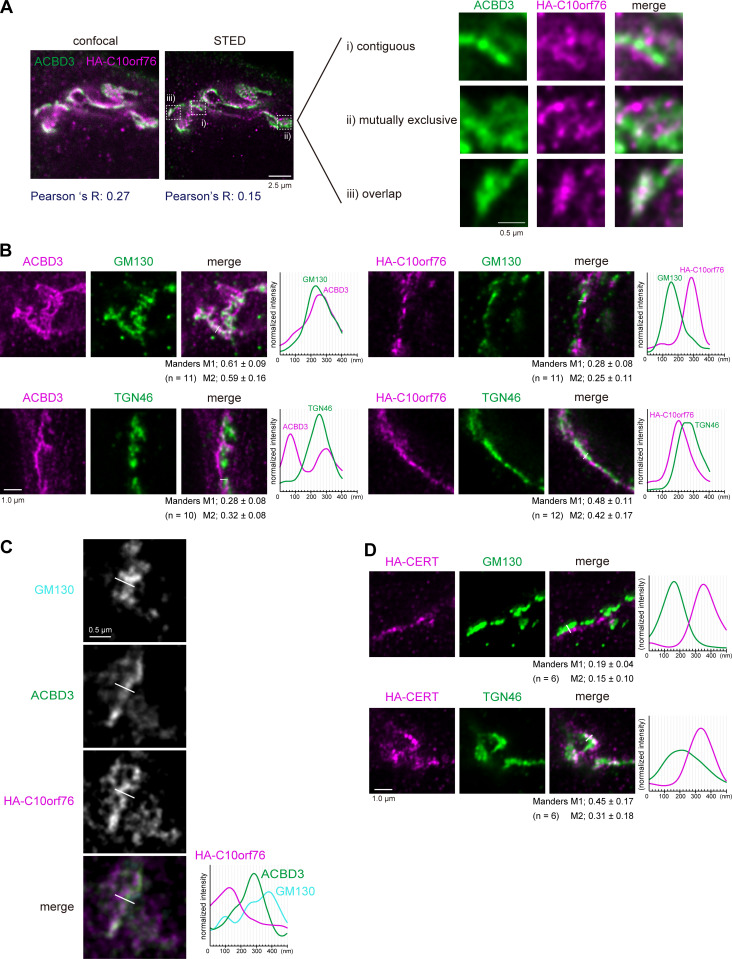
Figure 5.
ACBD3 and C10orf76 localize at distinct subregions in the Golgi apparatus. (A) STED microscopy observation of ACBD3 and HA-C10orf76. The C10orf76 KO cells stably expressing HA-C10orf76 were immunostained with anti-ACBD3 and anti-HA antibodies and imaged using confocal or super-resolution STED microscopy. (B) STED microscopic observation of the intra-Golgi distribution patterns of ACBD3 and C10orf76. ACBD3 and HA-C10orf76 were co-stained with a cis-Golgi marker, GM130, or a TGN marker, TGN46. (C) GM130, ACBD3, and HA-C10orf76 were co-stained and observed under STED microscopy. (D) STED microscopic observation of the intra-Golgi distribution patterns of HA-CERT. The CERT KO cells stably expressing HA-CERT were immunostained with anti-HA + anti-GM130 antibodies or anti-HA + anti-TGN46 antibodies and imaged using STED microscopy. (B–D) Graphs represent the line profiles of ROIs (depicted by white lines): x-axis, distance; y-axis, normalized signal intensities. Scale bars, 1.0 µm. (B and D) The mean ± SD of Manders correlation coefficient (MCC) and the cell numbers (n) analyzed are shown. MCC M1 represents the colocalization rate of the protein of interest with the marker protein. M2 represents the colocalization rate of the marker protein with the protein of interest. Source data are available for this figure: SourceData F5.

