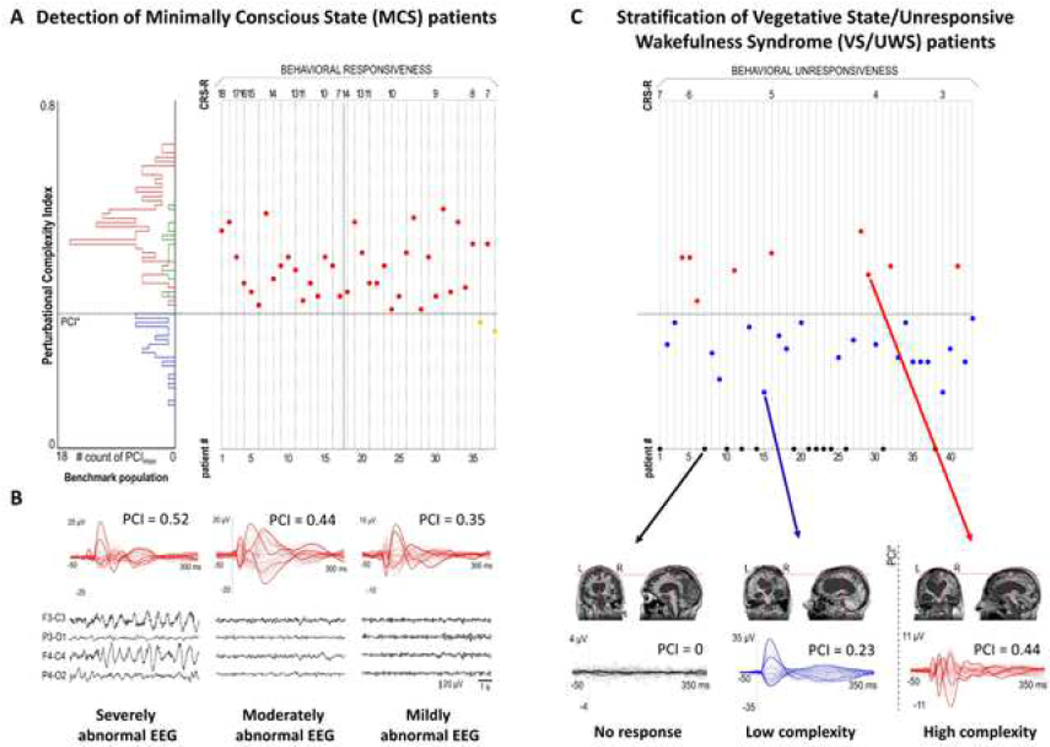
Figure 5: TMS-EEG.
and Perturbational Complexity Index (PCI) in a benchmark population, in minimally conscious state and Unresponsiveness Wakefulness Syndrome patients. (A) Distribution of maximum PCI values computed in the benchmark population (left) in the absence of subjective report (blue line) and in the presence of subjective report (delayed, green line; immediate, red line). The dashed horizontal line indicates the cut-off (PCI*) optimally discriminating consciousness from unconsciousness in the benchmark population. The scatter plot shows the maximum PCI values obtained in individual minimally conscious state (n = 38) patients, sorted by the Coma Recovery Scale-Revised (CRS-R). For each patient, the PCI is represented by a color-filled circle (Modified from Casarotto et al., 2016). (B) The upper row shows TMS evoked potentials [TEPs] (butterfly plot of all EEG channels superimposed, with three illustrative channels highlighted by bold red traces) together with the corresponding PCI values in three representative minimally conscious state patients with PCI higher than PCI*. The lower row shows 10 s of spontaneous EEG recorded from four bipolar EEG channels (F3-C3, P3-O1, F4-C4, and P4-O2) in the same patients. Note that despite having all PCI values above PCI*, minimally conscious state patients displayed patterns of spontaneous background EEG activity that were severely abnormal (left), moderately abnormal (center), and mildly abnormal (right) (Modified from Casarotto et al., 2016). (C) PCI-based stratification of Unresponsiveness Wakefulness Syndrome patients. The scatter plot shows all the maximum PCI values obtained in individual Unresponsiveness Wakefulness Syndrome (n = 43) patients. For each patient, the PCI is represented by a colour-filled circle. Unresponsiveness Wakefulness Syndrome patients could be stratified into three subgroups according to PCI values: high-complexity patients with PCI > PCI* (n = 9, red), low-complexity patients with PCI < PCI* (n = 21, blue), and no-response patients with PCI = 0 (n = 13, black). The lower row shows the structural MRI, the TEP and the corresponding PCI value reported for a representative subject of each subgroup (modified from Casarotto et al., 2016).

