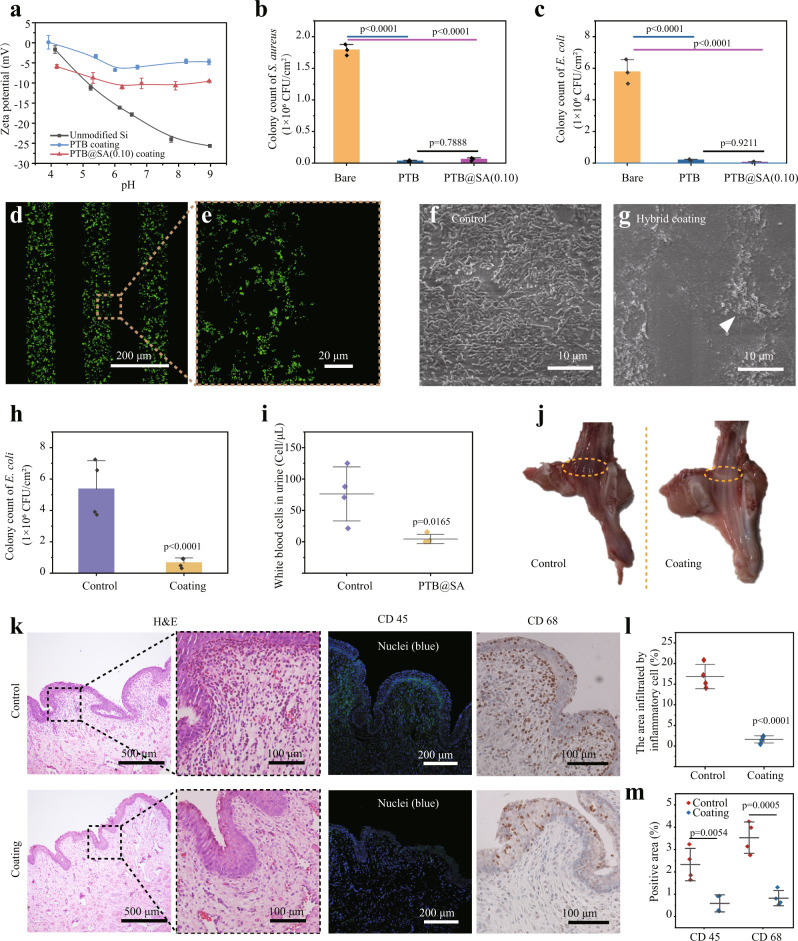
Fig. 4. The anti-biofilm performance and biocompatibility of the hybrid coating.
a Zeta potential of the PTB or PTB@SA(0.10) coating on Si. n = 3 independent samples per group. b, c Number of viable S. aureus (b) and E. coli (c) recovered from bare substrate, PTB, or PTB@SA(0.10) coating as confirmed by colony counting. n = 3 independent samples per group. d, e CLSM images showing the patterned adherence of S. aureus on a bare substrate using the micropatterned PTB@SA coating as the resistant layer. f, g SEM images of unmodified (f) or PTB@SA(0.10) coating-modified urinary catheters (g) recovered after indwelling for 1 week. The arrow indicates scattered bacteria on the PTB@SA(0.10) coating. h In vivo anti-biofilm efficiency of the hybrid coating measured by colony counting. n = 4 animals per group. i The number of white blood cells in rabbit urine after different catheters were used for 1 week. n = 4 animals per group. j Gross observation of the rabbits’ urethra and the yellow circles represent the sampling site of the tissue section. k Hematoxylin and eosin (H&E) staining and immunochemical staining with anti-CD 45 antibody (green) and anti-CD 68 (brown) antibody in rabbit urethral tissue. l Quantification of the area of inflammatory cell infiltration in the H&E staining images of the urethra. n = 4 animals per group. m Quantification of CD 45 (l) and CD 68 (m) positive area in Fig. 4k. n = 4 animals per group. The experiments in (d–g) were repeated independently at least three times with similar results. All data are mean ± S.D. Statistical significance was determined by one-way ANOVA with Tukey’s multiple comparison test (b, c), two-tailed Student’s t-test (h, l, m), or two-tailed Welch’s t-tests (i). Source data are provided as a Source Data file.

