Figure 1.
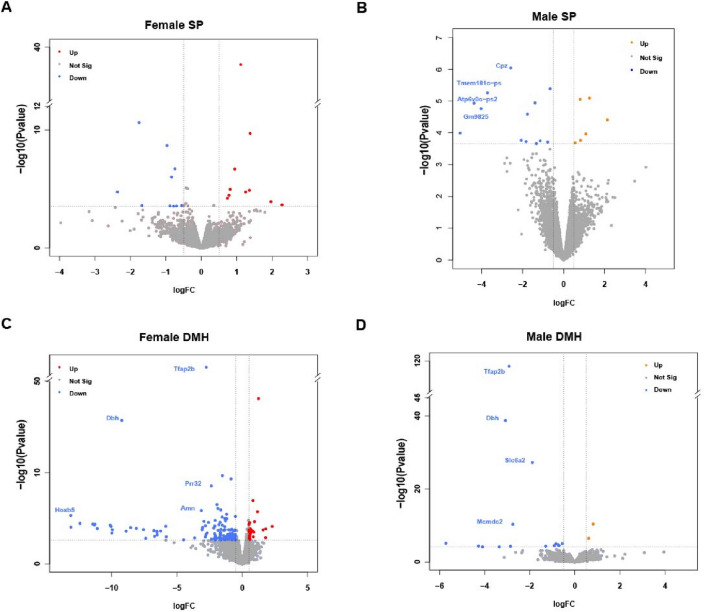
Genes differentially expressed in Tfap2b−/− developing mouse brains. We compared gene expression between homozygous mutant embryos (E14.5) and their wild-type littermates. Volcano plots showing the significantly up-regulated (red) and down-regulated genes (blue) in female SP (A) and DMH (B). Up regulated genes are presented in orange for male (C) and DMH (D). We compared gene expression between homozygous mutant embryos (E14.5) and their wild-type littermates. Significantly changed genes as defined by an FDR (False Discovery Rate) < 0.2 and a logFC > 0.5 were highlighted and the most robustly regulated genes were labeled (FDR < 0.01; logFC > 2). Female E14.5 embryos tfap2b+/+, n = 3; female E14.5 embryos tfap2b−/−, n = 2 (based on PCA analysis shown in Fig. S1, the sample named “mut3” was excluded from the DE genes analysis); male E14.5 embryos tfap2b+/+, n = 3; male E14.5 embryos tfap2b, n = 3; SP, secondary prosencephalon; DMH, diencephalon, midbrain and hindbrain.

