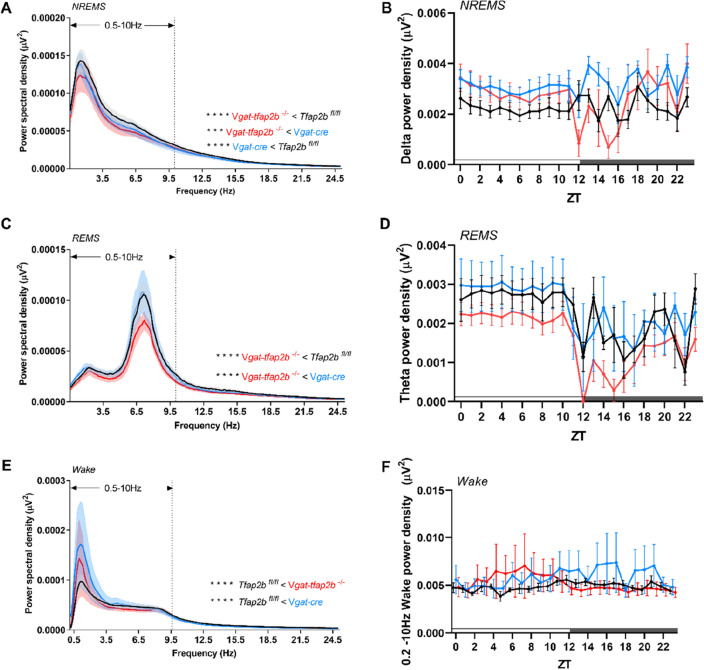
Figure 5.
Reduced delta and theta power during NREM and REM sleep, respectively, in female Vgat-tfap2b−/− mice. NREMS power spectra in 24 h scale (A) and delta power (0.5 – 4.0 Hz) changes over ZT course (B). REMS power spectra in 24 h scale (C) and theta power (5 – 10 Hz) changes over ZT course (D). Wake power spectra and 0.2—10 Hz power changes over ZT course. Data in (A, C, E) were analyzed using Friedman test followed by Dunn’s multiple comparisons test. Data in (B, D, F) were analyzed by two-way ANOVA followed by Sidak’s multiple comparisons test and were shown as the mean ± SEM. Highlighted is the 0.5–10 Hz frequency band (A, C, E), which was used for statistical analysis. Significant pairwise comparisons of Tfap2bfl/fl vs. Vgat-tfap2b−/− were marked with ***P < 0.001, ****P < 0.0001. Female Tfap2bfl/fl (n = 5), Vgat-cre (n = 5), Vgat-tfap2b−/− (n = 5).

