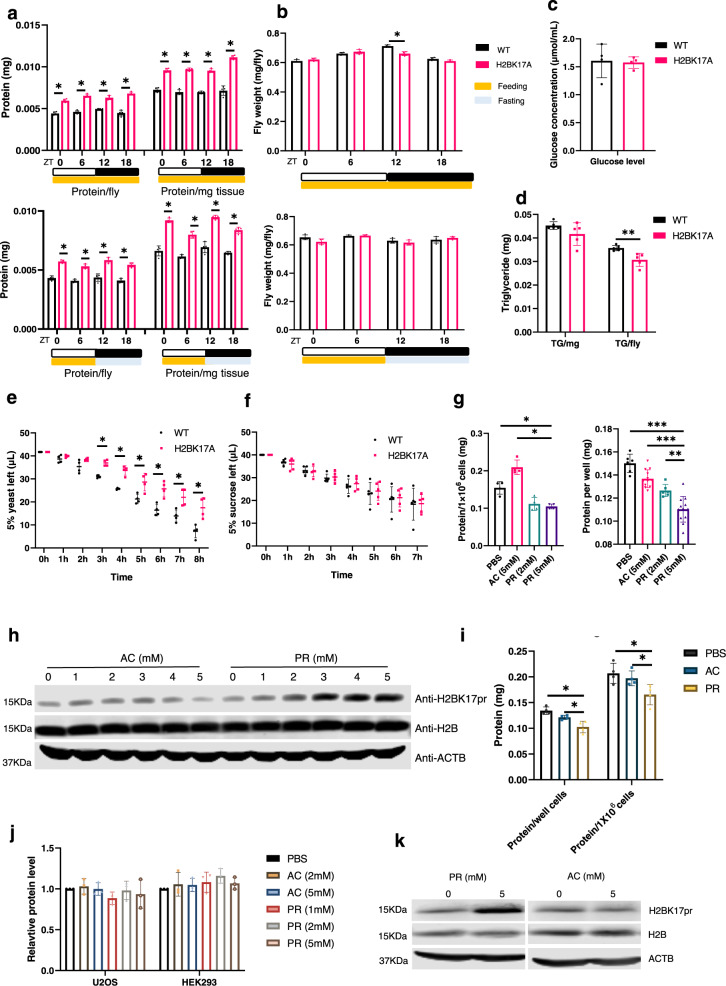
Fig. 4. H2BK17pr regulates proteostasis.
a Histograms show the total protein level of WT and H2BK17A fly heads under AL (upper panel) or TRF condition (lower panel) at the indicated ZT (n = 4 biologically independent experiments, two-tailed Mann–Whitney U test for unpaired comparisons, * p = 0.02857). b Histograms show the weight of WT and H2BK17A flies under AL (upper panel) or TRF condition (lower panel) at the indicated ZT (n = 4 biologically independent experiments, two-tailed Mann–Whitney U test for unpaired comparisons, * p = 0.02857). c Histogram shows the glucose level of WT and H2BK17A flies (n = 4 biologically independent experiments, two-tailed Mann–Whitney U test for unpaired comparisons). d Histogram shows the triglyceride level of WT and H2BK17A flies (n = 5 biologically independent experiments, two-tailed Mann–Whitney U test for unpaired comparisons, ** p = 0.007937). e Histogram shows the yeast consumption of WT and H2BK17A flies measured by CAFÉ assay (n = 4 biologically independent experiments, two-tailed Mann–Whitney U test for unpaired comparisons, * p = 0.02857). f Histogram shows the sucrose consumption of WT and H2BK17A flies measured by CAFÉ assay (n = 5 biologically independent experiments, two-tailed Mann–Whitney U test for unpaired comparisons). g Histograms show total protein level of S2 cells treated with sodium propionate and sodium acetate or equal volume of PBS as control (n = 4 biologically independent experiments, two-tailed Mann–Whitney U test for unpaired comparisons, * p = 0.02857, ** p = 0.006895, *** p = 0.000008). h Western blots of protein extracts from S2 cells treated with sodium propionate and sodium acetate at indicated concentrations for 24 h. ACTB is used as a loading control. i Histogram demonstrates total protein level of AC16 cells treated with sodium acetate or sodium propionate at 5 mM for 48 h, or equal volume of PBS as control (n = 4 biologically independent experiments, two-tailed Mann–Whitney U test for unpaired comparisons, * p = 0.02857). j Histogram demonstrates relative protein level of U2OS and HEK293 cells treated with sodium acetate and sodium propionate for 48 h at indicated concentrations, or equal volume of PBS as control (n = 3 biologically independent experiments, two-tailed Mann–Whitney U test for unpaired comparisons). The protein level of PBS treatment is set to 1. k Western blots of protein extracts from AC16 cells treated with sodium propionate or sodium acetate under indicated concentrations. ACTB is used as a loading control. Data are presented as the mean ± SD. AC sodium acetate, PR sodium propionate. The blotting experiments were conducted with three independent repeats with similar results (h and k). Source data are provided as a Source Data file.

