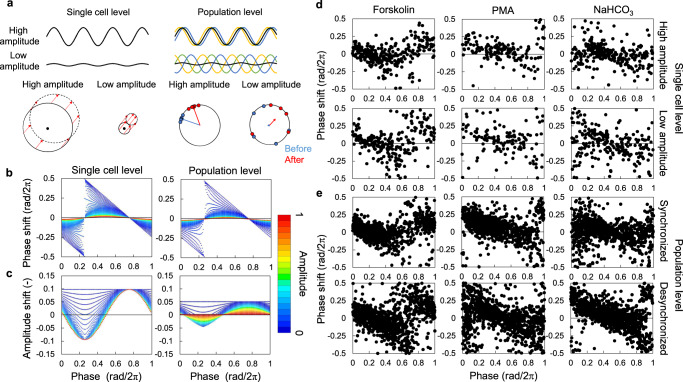
Fig. 1. Amplitude dependency of PRCs at the cellular and population levels.
a Models of circadian rhythm and phase response at the cellular and population levels. b Mathematical models for PRC at the single cell and population levels. c Mathematical models for amplitude response curve at the single cell and population levels. PRCs for forskolin, PMA, and NaHCO3 at the single cell (d) and population levels (e). At the population level, one sample contains five cells, which are randomly selected. Concentrations of forskolin, PMA, and NaHCO3 were 0.75 μM, 2 μM, and 77.75 mM for single-cell PRCs and 0.5 μM, 1 μM and 66.5 mM for population PRCs, respectively. In single-cellular PRCs, an amplitude of A > 0.6 was defined as high amplitude, while A < 0.4 was considered low amplitude. In population PRCs, an amplitude (synchronization index) of R > 0.8 was defined as synchronized, while R < 0.1 was considered desynchronized.

