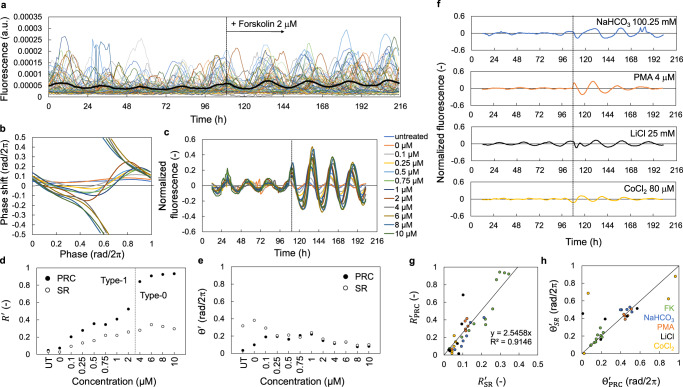
Fig. 2. Relationship between parameters of PRC and SR in NIH3T3 cells.
a Fluorescence signals derived from Reverbα-Venus-NLS-PEST reporter at single-cellular level are shown. The black line is averaged fluorescence signal, indicating the population rhythms. A stimulus of 2 μM forskolin was applied to cells 108 h after the beginning of the measurement. b PRCs for forskolin treatment at different concentrations at single-cellular level. c SRs to forskolin at different concentrations. Fluorescence rhythms of all individual cells were averaged and then normalized. The dotted line indicates the treatment of forskolin. d Amplitude parameter R′ in SRs and PRCs. “UT” represents untreated condition. e Phase parameter Θ′ in SRs and PRCs. f SRs to indicated resetting agents. Fluorescence rhythms of all individual cells were averaged and then normalized. The dotted lines indicate the treatments. g Amplitude of PRCs and SRs for different concentrations of agents. The linear black line is the regression line for calibration parameter β in Eq. (7). R2 is the coefficient of determination. FK means forskolin. h Phase of PRCs and SRs for different concentrations of agents. The linear black line indicates the line of y = x.

